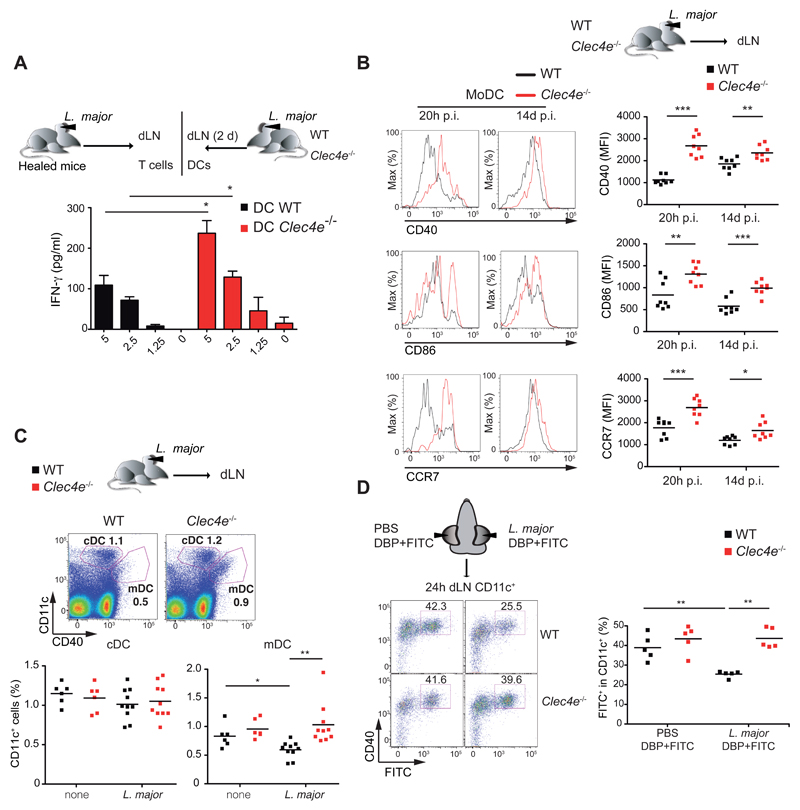
Figure 5. Enhanced DC activation and migration to dLNs after L. major infection in Mincle-deficient mice.
(A) IFN-γ in supernatants of T cells from healed L. major-infected mice after co-culture for 3 d with CD11c+ cells recovered from the dLNs of WT and Clec4e-/- mice 2 d p.i. Data are arithmetic means + SEM from two independent experiments (n=6). (B) Left panels: Representative histograms of CD40, CD86 and CCR7 staining in MoDCs (CD11b+Ly6C+CD11c+MHCII+ gated cells) from ears of infected mice. Right panels: Mean fluorescence intensity (MFI) of CD40, CD86 and CCR7 expression on MoDCs. (C) Representative dot plots (Upper) and frequencies (Lower) of CD11c- and CD40-positive cells in dLNs from uninfected mice or 24 h after L. major infection in the ear. (D) Ears of mice inoculated with PBS in the left ear and L. major parasites (105) in the right ear were FITC painted (see Methods) and dLNs were harvested 24h later. Left : Representative plots of dLN cells gated for CD11c and stained with anti-CD40 and FITC. Right: frequencies of FITC+ CD11c+ dLN cells. (B-D) Individual data and arithmetic means corresponding to a representative experiment of two (B) or three (C, D) performed. (A-D) * p < 0.05; ** p < 0.01; *** p < 0.001 (Student’s t test).

