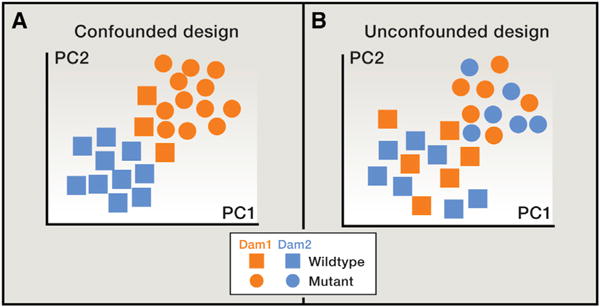
Figure 2. The Maternal Effect Can Confound the Experimental Effect.

(A and B) In this mock example, each point represents a gut microbial community as characterized by a set of 16S rRNA gene sequences from a single mouse sample. In principal coordinates analysis (PCoA), points that are closer together represent microbial communities that are more similar in sequence composition. Samples from two different mouse genotypes are represented, and the mice are derived from two different dams. In all panels, squares indicate wild-type, and circles indicate mutant mouse genotypes. In (A), the effect of genotype is confounded by the effect of a shared dam, whereas in (B), the effect of dam is randomized across the two genotypes.
