
Figure 8.
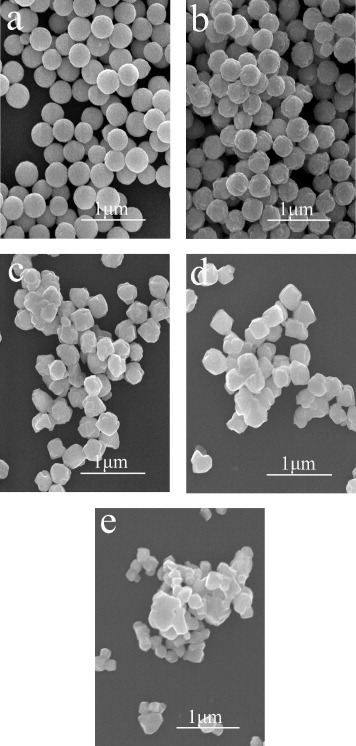
FE-SEM images showing morphologies of sample S5 annealed at 800 ○C (a), 1000 ○C (b), 1200 ○C (c) and 1300 ○C (d) for 4 h. Also shown is sample S11 annealed at 1300 ○C for 4 h (e).
Official websites use .gov
A
.gov website belongs to an official
government organization in the United States.
Secure .gov websites use HTTPS
A lock (
) or https:// means you've safely
connected to the .gov website. Share sensitive
information only on official, secure websites.
FE-SEM images showing morphologies of sample S5 annealed at 800 ○C (a), 1000 ○C (b), 1200 ○C (c) and 1300 ○C (d) for 4 h. Also shown is sample S11 annealed at 1300 ○C for 4 h (e).