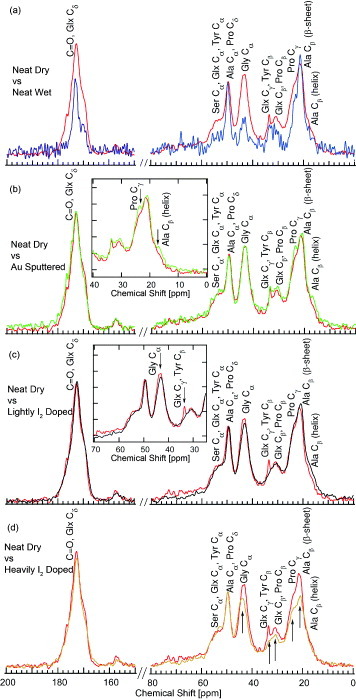
Figure 10.

1H–13C CP-MAS spectra of N. clavipes dragline silk fibers. (a) Neat silk fibers in dry (upper red curve) and hydrated (lower blue curve) state. The results of Creager et al [21] were used to make the amino acid assignments. Except for the Ala Cα and Ala Cβ (β-sheet) peaks, the hydrated spectra are lower in intensity. (b) Neat (red) and gold-sputtered (green) silk fibers. Inset: detail of slight intensity increase in Pro Cγ and Ala Cβ (helix) peaks after gold sputtering. (c) Neat (upper red curve) and lightly I2-doped (lower black curve) silk fibers. Inset: detail of decrease in Gly Cα and Glx Cγ (Tyr Cβ) peaks after I2 doping. (d) Neat (upper red curve) and heavily I2-doped (lower orange curve) silk fibers. Intensity reduction in most peaks is indicated by the arrow.
