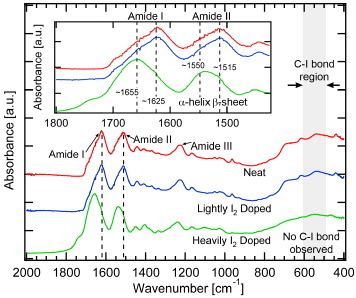
Figure 11.

FTIR spectra of neat (top red curve), lightly I2-doped (middle blue curve) and heavily I2-doped (bottom green curve) N. clavipes silk fibers. Inset: reduction of β-sheet band relative intensity at ∼1625 (I) and ∼1515 cm−1 (II) and increase of α-helix band relative intensity at ∼1655 (I) and ∼1550 cm−1 (II), in the amide I and II regions. No C–I bond is observed within the expected region (gray area) in any case.
