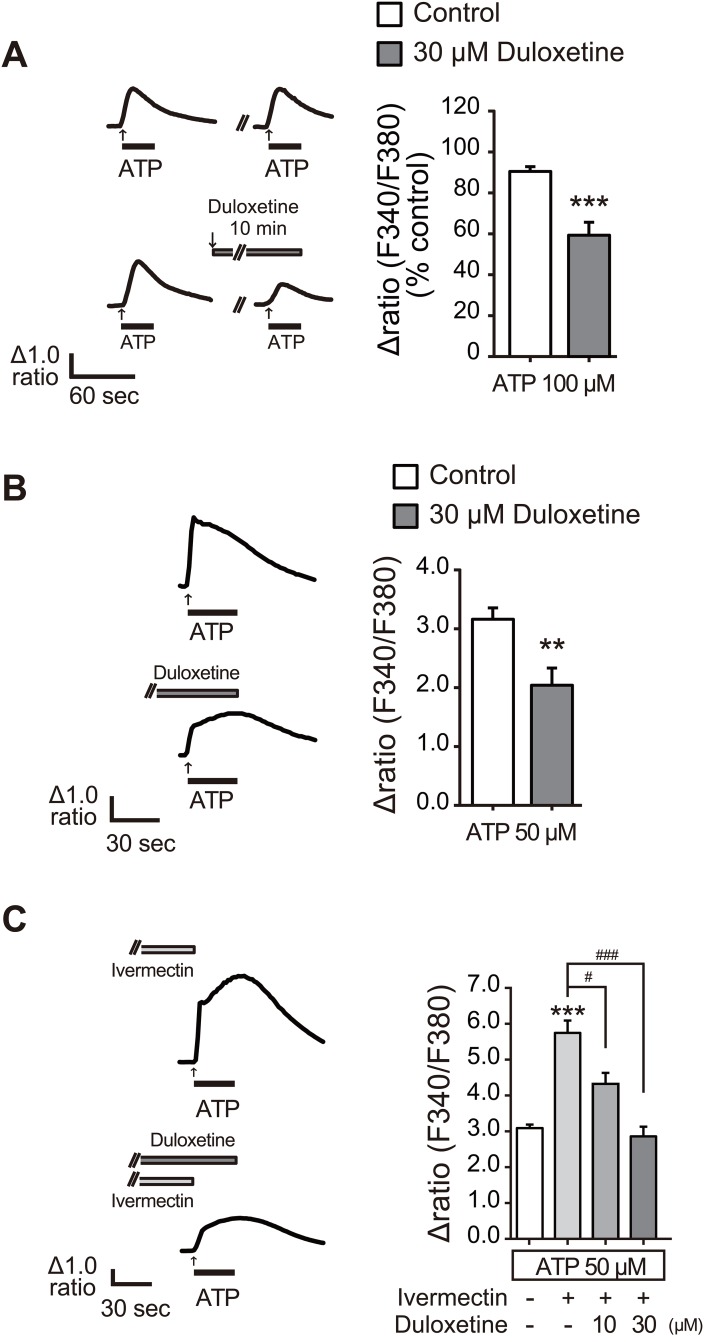
Fig 3. Duloxetine inhibited microglial P2X4R function.
(A) Representative average traces of [Ca2+]i increases in response to ATP (100 μM for 30 s) with or without duloxetine (30 μM for 10 min) measured by a single cell analysis in C8-B4 cells. Each column shows the effect of duloxetine evaluated by the S2 (2nd [Ca2+]i response) / S1 (1st [Ca2+]i response) (n = 4, ***P < 0.001 vs. control). (B) Representative average traces of [Ca2+]i increases in response to ATP (50 μM for 30 s) with or without duloxetine (30 μM for 10 min) measured by single cell analysis in rat microglial cells. Each column shows the relative increase ratio (F340/F380) from the basal level prior to ATP application (n = 4, **P < 0.01 vs. control). (C) Representative average traces of [Ca2+]i increases in response to ATP (50 μM for 30 s) in combination with ivermectin (3 μM, 3 min) with or without duloxetine (30 μM for 10 min) measured by single cell analysis in rat microglial cells. Each column shows the relative increase ratio (F340/F380) from the basal level prior to ATP application (n = 4, **P < 0.01, ***P < 0.001 vs. control, #P < 0.05, ###P < 0.001). Data represent mean ± SEM for all groups.

