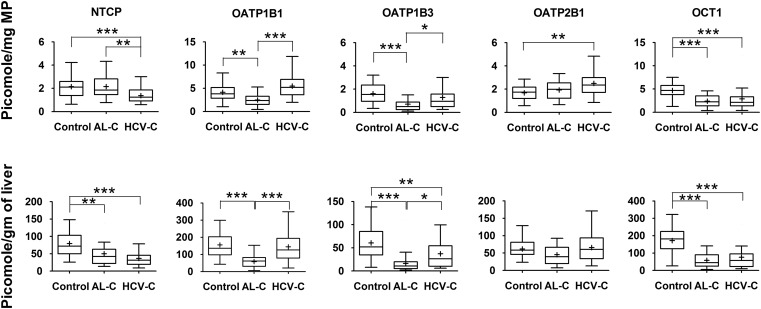
Fig. 2.
Hepatic uptake transporter protein expression in alcoholic cirrhosis (AL-C), and hepatitis C cirrhosis (HCV-C) livers differed from that in control livers. This difference was transporter- and disease-dependent and also depended on whether the data were normalized to milligram of membrane protein (MP; upper panel) or gram of liver (lower panel). Horizontal line, median; +, mean; boxes, 25th to 75th percentiles; whiskers, non-outlier range. *p < 0.05; **p < 0.01; ***p < 0.001. MP, Membrane protein.

