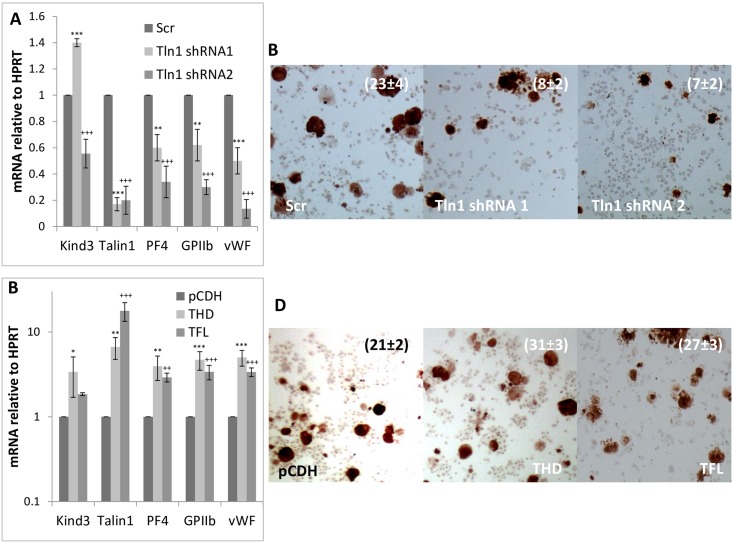
Fig 4. Effect of manipulating Talin1 expression on megakaryocytic differentiation.
A. Kindlin3, Talin1 and megakaryocytic marker (platelet factor 4, glycoprotein IIb/CD41 and von Willebrand factor) message levels in control (Scr; scrambled) and Talin1 knocked down fetal liver cells differentiated into megakaryocytes. B. Acetyl choline esterase staining of the corresponding cells. P values were <0.001 for the cell counts. C. Message levels of indicated factors in control (pCDH; empty vector), Talin1 head domain (THD) and full length (TFL) over-expressing fetal liver cells differentiated into megakaryocytes. P values are represented by various (*, §, +) symbols for different data series with values of < 0.05, 0.01 and 0.001 being indicated by one, two and three symbols, respectively. D. Acetylcholine esterase staining of the corresponding cells. The mean ± s.d. of acetylcholine-positive cells as a percentage of the total population from three independent experiments is indicated. P values ranged from <0.05 to <0.01.

