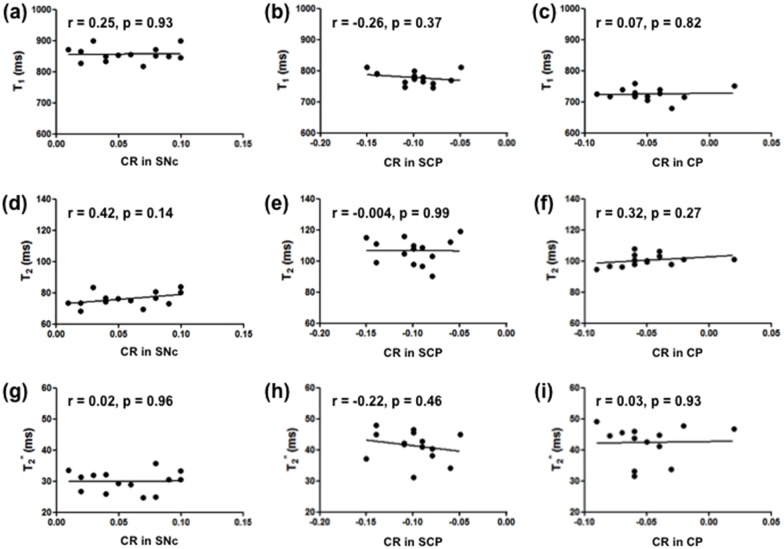
Fig 5. Correlations between the CR and quantitative T1, T2, and T2* relaxation times.
(a, d, g) Correlation between each relaxation time and the CR in the SNc. (b, e, h) Correlation between each relaxation time and the CR in the SCP. (c, f, i) Correlation between each relaxation time and the CR in the CP. The average values of the CRs and relaxation times in the left and right side of each region were used.

