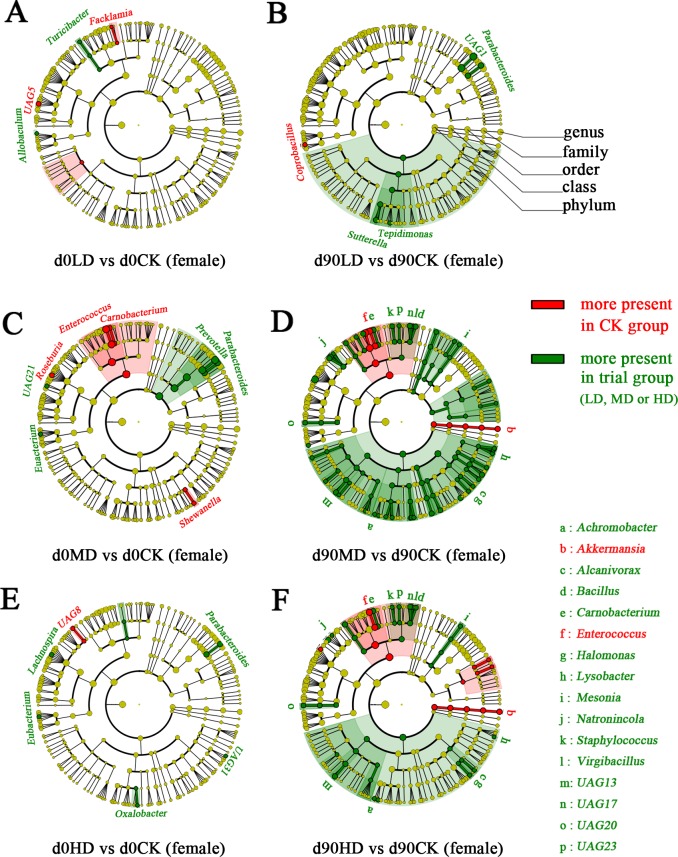
Fig 3. The bacterial genera affected by PC-hepc in gut microbiota of female rats according to LEfSe analysis.
A, C, and E show the comparisons of gut microbiota between LD and CK, MD and CK, HD and CK on day 0 respectively. B, D, and F show the comparisons of gut microbiota between LD and CK, MD and CK, HD and CK on day 90 respectively. The circles from the outside to the inside indicate genus, family, order, class, phylum, and kingdom. Red indicates this taxon was more present in CK group than in trial group. Green indicates this taxon was more present in trial group than in CK group. In A, B, C, and E, all the differently present genera are coloured and labeled, while in D and F, all the differently present genera are coloured, but only the genera changed both in female MD and HD group on day 90 are labeled due to the space limitation in this figure.

