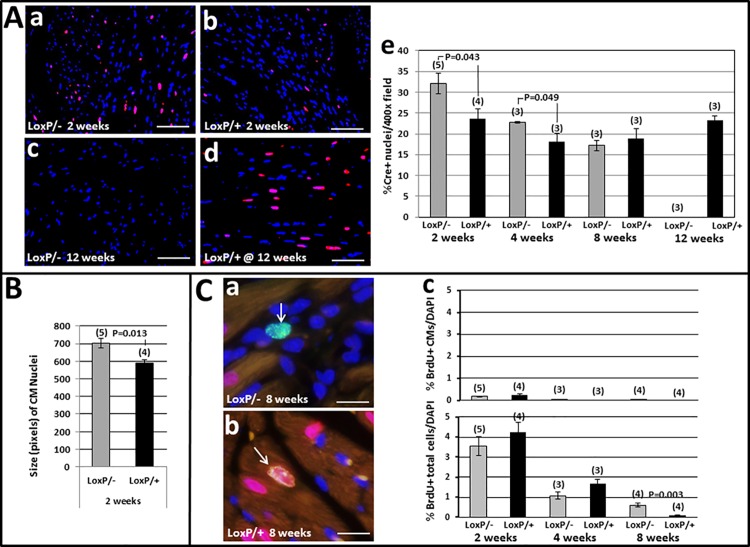
Fig 8. CM Density & Proliferation in Tip60-depleted Myocardium.
Panel A: CM Density. a-d, immunofluorescent Cre in CM nuclei (red) in comparison with total nuclei (blue, DAPI). Bars = 30 μm. e, percentage of Cre-positive nuclei relative to total DAPI-positive nuclei per 400x field determined by ImageJ. Panel B: Size of CM Nuclei determined by ImageJ. Panel C: CM Proliferation. a-b, double immunofluorescent BrdU (green) and Cre-recombinase (Cre; red) images. a, typical BrdU+ non-myocyte nucleus (arrow). b, BrdU+Cre double-labeled CM nucleus (arrow). Bars = 10 μm. c, upper and lower, percentages of BrdU-positive CMs and total cells, respectively. BrdU-positive nuclei were manually counted and expressed as a percentage of DAPI (blue)-stained nuclei determined by automated scanning. In all panels, bars = averages. N = number of mouse hearts evaluated, error bars = ±SEM. P-values were calculated using Student’s T-Test (two-tailed). All CMs contained the Myh6-Cre transgene.

