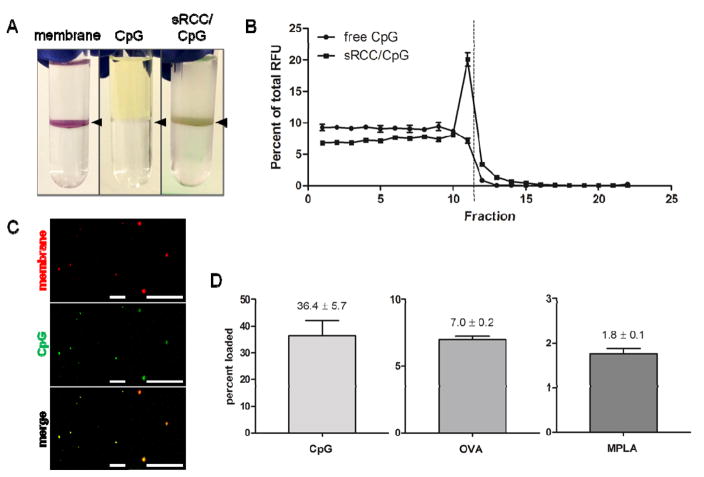
Figure 3.
Loading of RCCs with diverse payloads. (A) Visualization of RCCs stained with membrane dye (left), free fluorescent CpG (middle), and RCCs loaded with fluorescent CpG (right) following density centrifugation. Black arrowheads point to location of interface. (B) Quantification of fluorescence as a function of fraction following density centrifugation of free fluorescent CpG or fluorescent CpG loaded into sRCCs. Dashed line represents location of interface. (C) Co-localization of a membrane-associated dye and fluorescent CpG following loading into sRCCs at low magnification (left) and high magnification (right). All scale bars = 10 μm. (D) Loading efficiency of CpG, OVA, and MPLA into sRCCs. Numbers represent mean loading efficiency ± SD.

