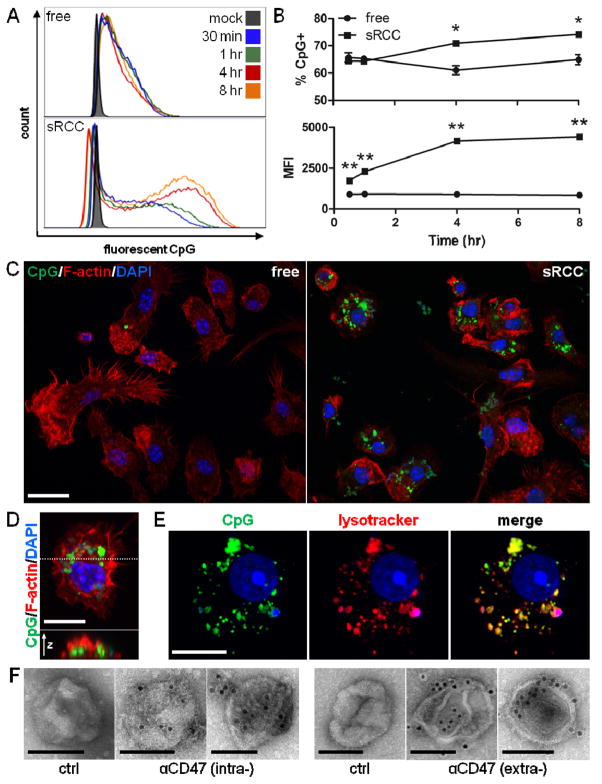
Figure 4.
BMDC uptake of sRCC-associated CpG. (A) Flow cytometry analysis of BMDC uptake of free or sRCC-associated fluorescent CpG at various timepoints. (B) Quantification of data shown in (A) presented as percent of cells CpG+ (top), and MFI (geometric mean) of CpG+ population (bottom). Data represent the mean ± SD, *p<0.05, **p<0.001. (C) Confocal microscopy of BMDC uptake of free or sRCC-associated fluorescent CpG after 4 hour incubation. Scale bar = 20 μm. (D) High magnification image of a CpG+ BMDC (top), and an orthogonal slice through the cell (bottom) taken at the position indicated by the dashed line. Scale bar = 10 μm. (E) Confocal image demonstrating colocalization of fluorescent CpG and lysotracker signals after 4 hour incubation. Scale bar = 10 μm. (F) Immunoelectron microscopy of sRCC stained with a primary antibody specific for either the intracellular (left) or extracellular (right) domains of CD47 followed by an appropriate 10 nm gold colloid-conjugated secondary antibody. Primary antibody was omitted for controls. Two representative sRCC images are shown for each antibody stain. Scale bars = 100 nm.

