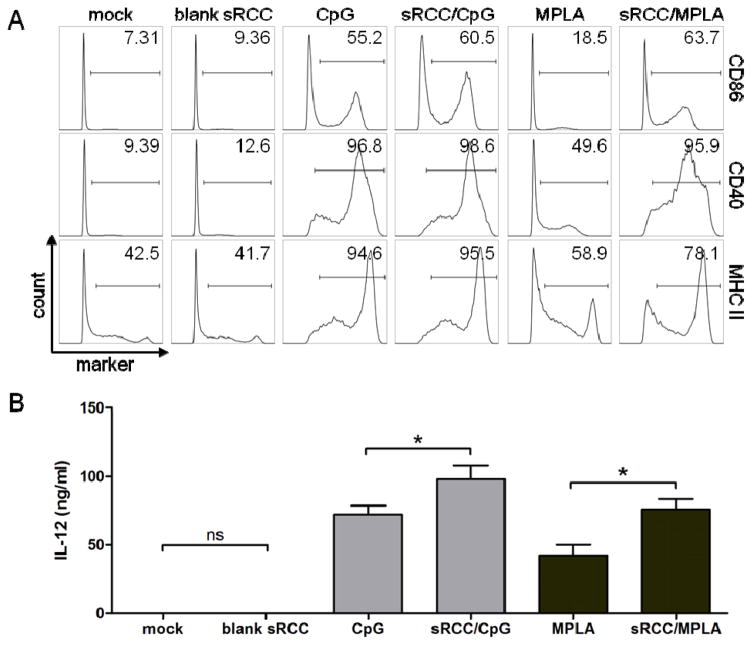
Figure 5.
DC activation in response to adjuvant-loaded sRCCs. (A) Flow cytometry analysis of DC surface activation marker expression, and (B) quantification of IL-12 production via ELISA, following mock treatment or treatment with blank sRCCs, treatment with 0.2 μM CpG in free or sRCC-associated form, or treatment with 0.02 μM MPLA in free or sRCC-associated form, after 12–15 hour incubation. Numbers in (A) represent average percent positive cells based on gate shown. Values in (B) represent the mean ± SD, *p<0.05.

