Figure 6.
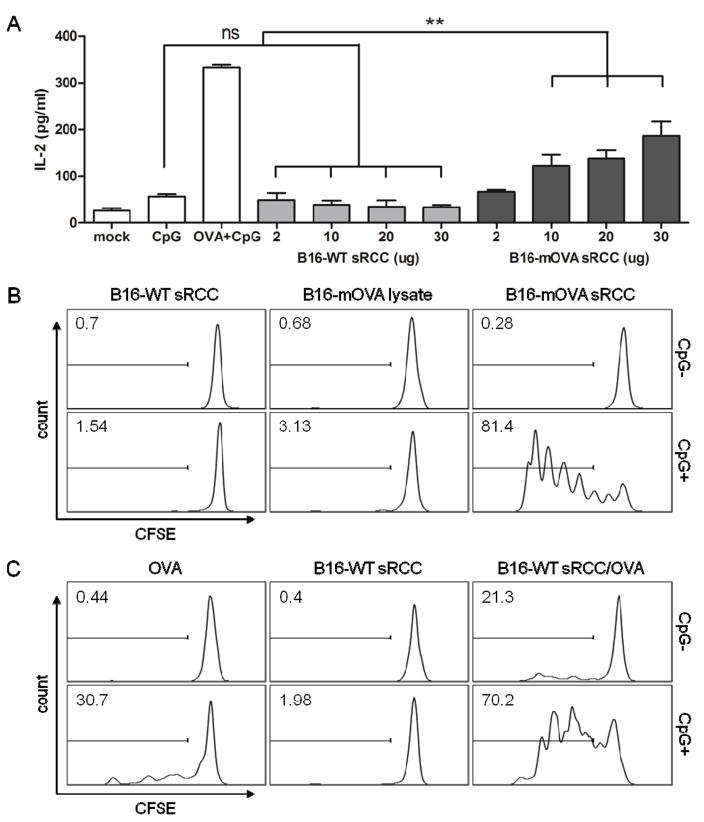
T cell response to sRCC-treated DCs. (A) Quantification of IL-2 production by MHC II-restricted MF2.2D hybridoma T cells in response to co-culture with DCs treated with B16-WT- or B16-mOVA-derived sRCCs. CpG samples were treated with 0.8 μM CpG, OVA samples were treated with 2.8 μM OVA, and OVA + CpG samples were treated with 2.8 μM OVA and 0.8 μM CpG. sRCC samples were treated with between 2–30 μg of sRCCs containing between 0.1–1.5 μg (78.6 nM–1.2 μM) CpG based on a total protein/CpG mass ratio of 1/0.05. (B) Representative histograms in which sRCC conditions represent T cell response to BMDCs treated with 13.9 μg sRCCs (+/− 0.3 μg CpG; 0.2 μM). Lysate conditions represent T cell response to BMDCs treated with lysate derived from an equivalent number of whole cells, and admixed with an equivalent amount of CpG. (C) Representative histograms in which OVA conditions represent T cell response to BMDCs treated with 44.4 nM free OVA with or without 78.6 nM free CpG, an equivalent amount of OVA and CpG loaded into B16-WT sRCCs, or an equivalent amount of blank B16-WT sRCCs. All co-culture experiments were carried out in 0.2 ml volume. Gates and values in (B–C) indicate the mean percentage positive cells in respective sample. Data in (A) represent the mean ± SD, analyzed using one-way ANOVA, followed by Tukey post-test, *p<0.05.

