
Figure 4.
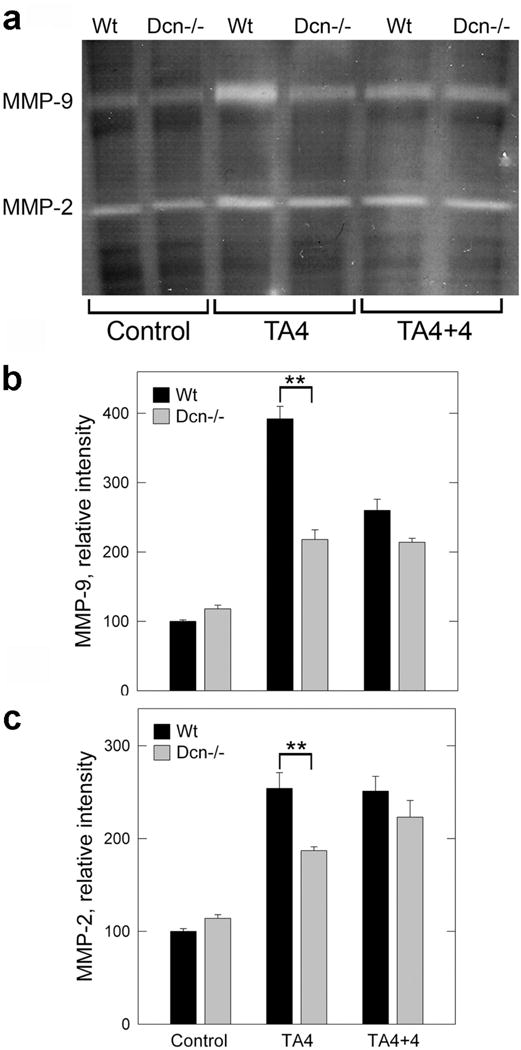
MMP elevation during hepatic fibrosis. (a) Zymogram using liver homogenates of wild-type and Dcn−/− mice without treatment (control), at 4 months of thioacetamide treatment (TA4), and at 4 months after the withdrawal of the chemical (TA4+4). (b,c) Quantification of zymograms as those shown in panel A using scanning densitometry. The values represent the mean intensity (%) ±SD of two experiments run in triplicate; **P<0.01