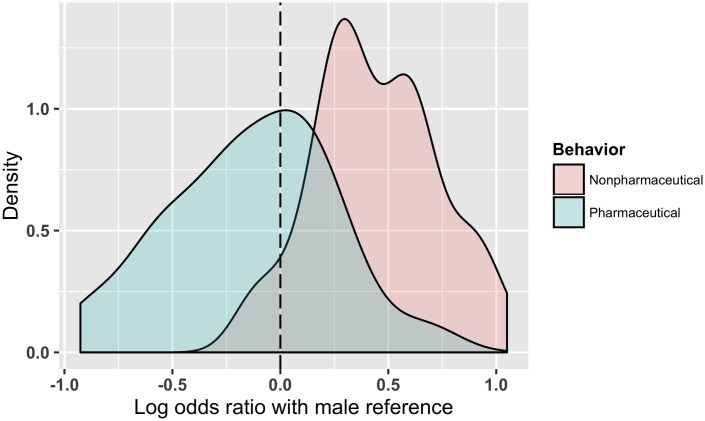
Fig 3. Density graph showing the sets of log odds ratios for pharmaceutical and non-pharmaceutical behaviors addressed for the 88 included study populations.
Males are used as the reference; positive log odds ratios correspond to females being more likely to adopt/practice a given behavior, and negative log odds ratios correspond to males being more likely to adopt/practice a given behavior. The set of non-pharmaceutical behaviors shown is trimmed such that the log odds ratio falling outside of three standard deviations from the mean is excluded.

