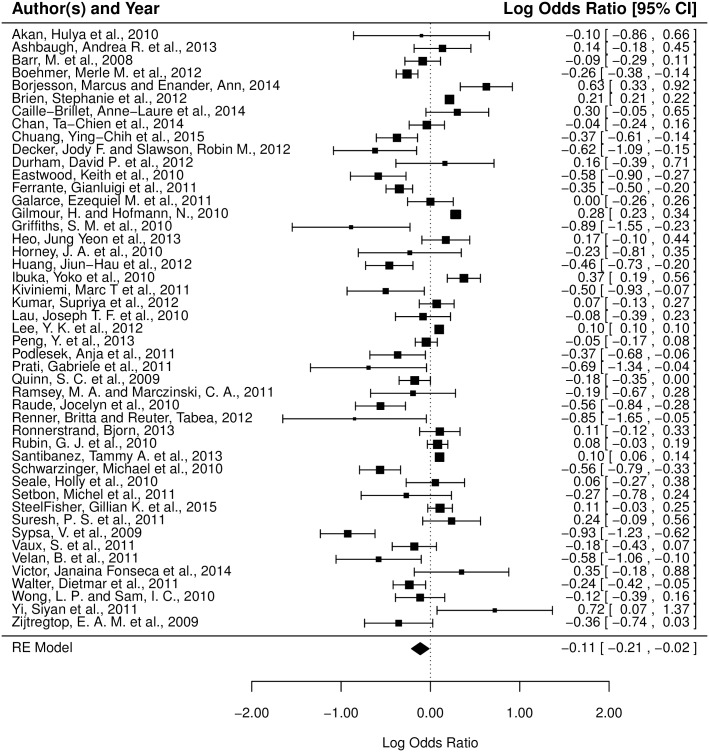
Fig 5. Forest plot of the associations between gender and pharmaceutical behaviors.
The effect size and confidence interval of each study are indicated by a square and a horizontal line, respectively. The weight of each study in the model is indicated by the size of its square. A log odds ratio of 0, indicated by the dashed reference line, corresponds to no gender difference in behavioral response. Positive log odds ratios correspond to greater behavioral response by females, while negative log odds ratios correspond to greater behavioral response by males. The population mean effect size of the random-effects model incorporating these studies is given by the placement of the diamond, while the horizontal corners of the diamond illustrate the 95% CI of this mean effect size. Publications with the same author(s) and year of publication are differentiated by the first word of their title. Publications including multiple studies are denoted by labeling the studies A, B, etc.

