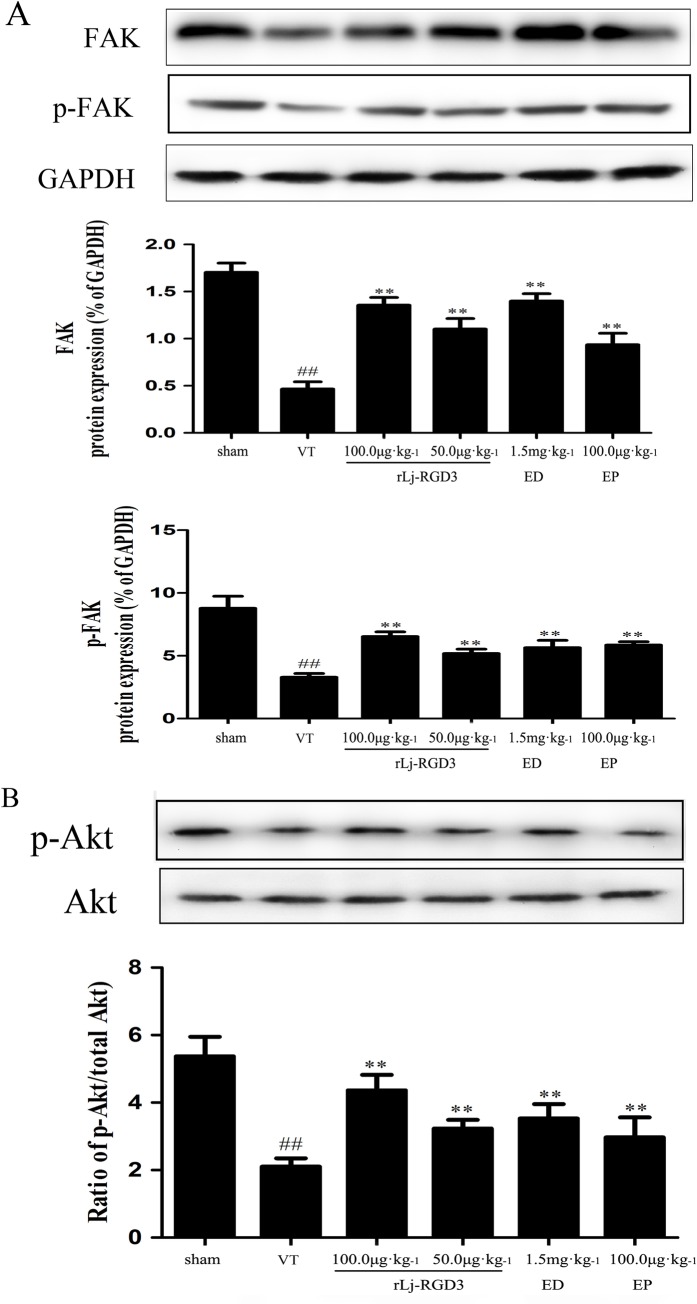
Fig 7. Expression of FAK proteins and the levels of p-FAK and p-Akt in focal cerebral ischemia/reperfusion rats as assayed using western blot analysis.
The protein bands shown in the figure were quantified after the bands were scanned and normalized to GAPDH bands. The results are presented as the mean ± SD of three independent experiments. The level of each protein was markedly lower in the VT group rats (##p <0.01 vs. the sham group), and the expression of p-FAK and p-Akt were higher in the rLj-RGD3 rats (** p<0.01 vs. the VT group) and the positive control drug groups. The high-dose rLj-RGD3 group (100.0 μg·kg-1) exhibited significantly higher levels of FAK protein expression. ##p <0.01 vs. the sham group. The data are shown as the means ± SD, n = 6.

