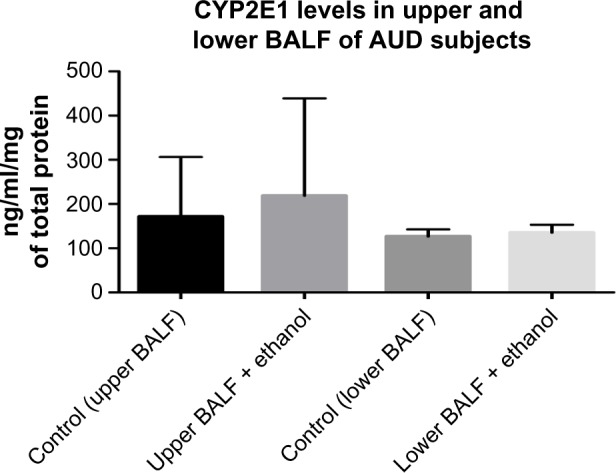
Figure 3.

CYP2E1 protein levels in BALF samples of AUD and Control subjects.
Notes: The level of CYP2E1 was increased (non-statistically) by 40% in the upper BALF samples of AUD subjects when compared to healthy control subjects. Similar trend was observed in the lower BALF samples of AUD subjects with an increase (non-statistically) of about 5% when compared to the control group (n = 40).
