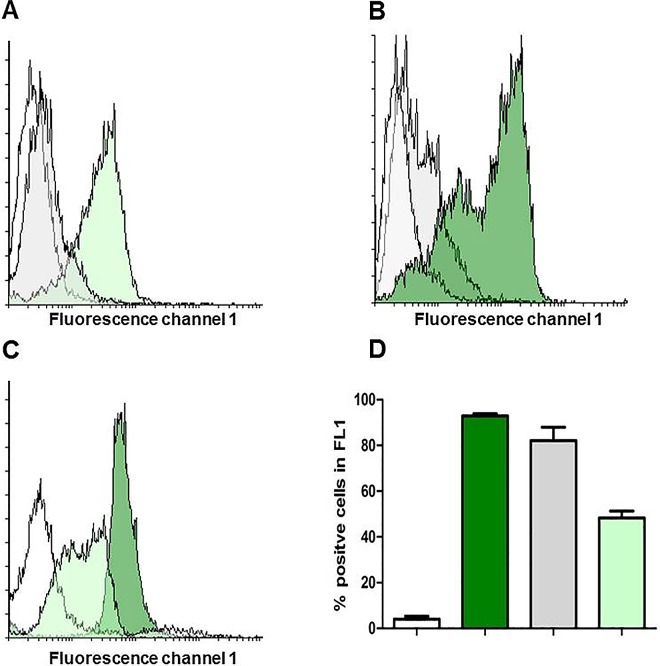
Fig 5. Neutralization effects assayed by flow-cytometry.
(A) and (B) show the different neutralization capacities of mAb 1G4 and 2G11. (A) supernatant of MHI 241 was neutralized by mAb 1G4 (green histogram) or mAb 2G11 (grey histogramm. (B) NheBC was incubated with 1G4 (green histogram) or 2G11 (grey histogram) neutralized rNheA. White histograms represent the negative controls (Vero cells incubated with primary and secondary antibodies. (C) overlay histogram after incubation of Vero cells with NheBC (adjusted to NheB at 150, 75 and 50 ng ml-1 and approx.15, 7.5 and 5 ng/ml-1 NheC, respectively) together with a constant amount of rNheA (150 ng ml-1) neutralized by mab 1G4; white = negative control; light green = NheB—50 ng/ml; dark green = NheB 150 ng/ml for reasons of overview results obtained with 75 ng/ml-1 NheB have only be included in the bar chart in (D); (D) means and SDs for NheA cells positive in fluorescence channel 1; colors correspond to those in the overlay histogram (C).

