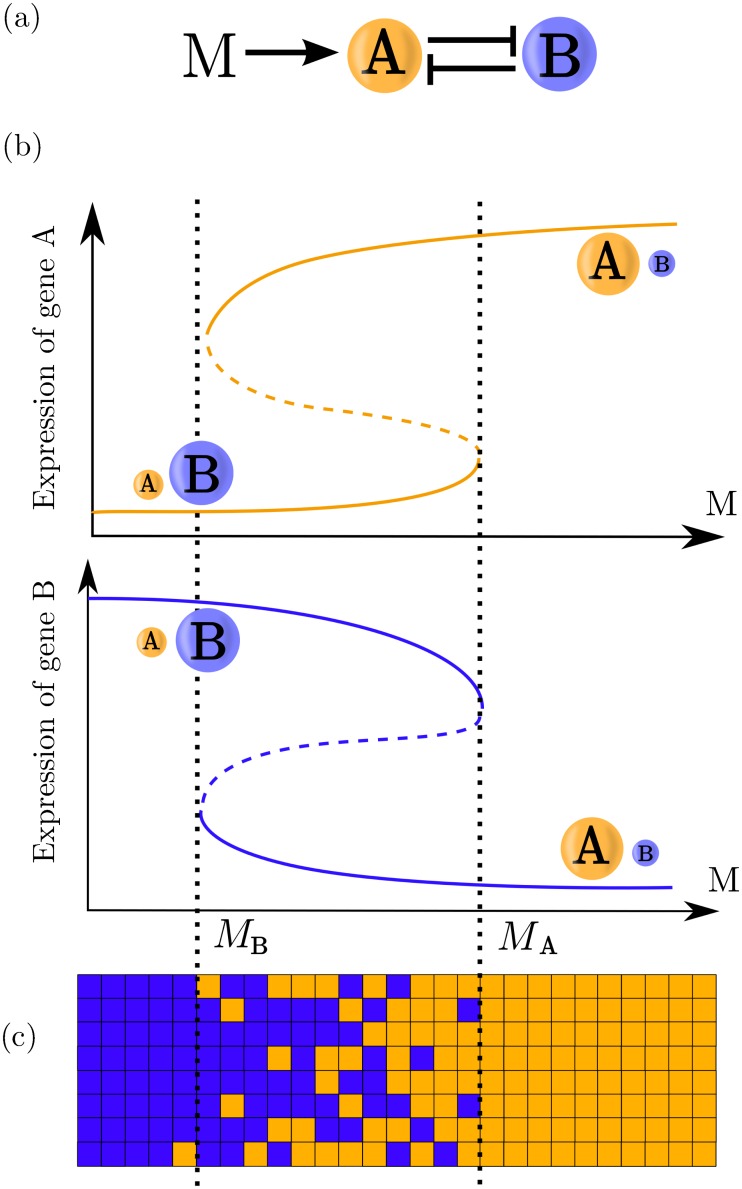
Fig 1. Bistable switch patterning schematic.
(a) Genetic network showing the cross-repression of genes A and B. The signal M activates gene A changing the available steady states. (b) Stability diagrams for expression of genes A and B showing the available steady states for different values of the signal. Stable steady states are indicated with solid lines, while the unstable steady state (in this case a saddle point) is indicated with a dashed line. (c) A schematic of tissue patterning with the genetic toggle switch: In the monostable zones (to the left and right of the vertical dotted lines) cells will adopt the state B or A, respectively. The state adopted by a cell in the bistable zone (between the vertical dotted lines) will be determined by the history of the signal and by stochastic effects.

