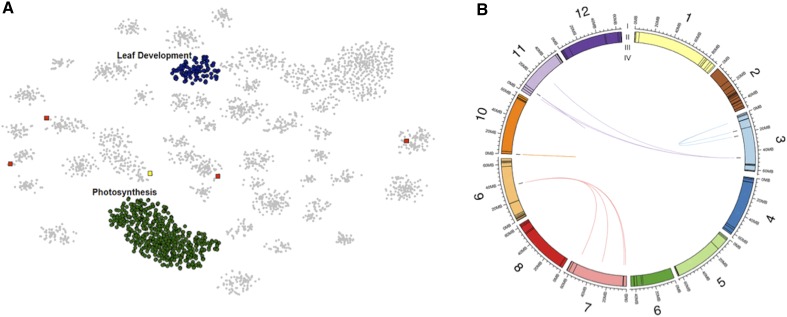
Figure 7.
eQTL regulation of transcript abundance patterns that correlate with hypocotyl length. A, Forty-two distinct modules identified by DBscan from the eQTL mapping generated by BH-SNE analysis. Modules enriched for genes with leaf development and photosynthesis GO terms are labeled in blue and green, respectively. Genes with transcript levels correlated with hypocotyl length under simulated shade are indicated by squares with positive correlations in red and negative correlations in yellow. B, Genes with transcript levels correlated with hypocotyl length under simulated shade are shown connected to their respective eQTL with chords. I, The 12 tomato chromosomes in megabases. II, Colored boxes indicate the sizes of each bin. III, Black bars indicate the locations of the genes. IV, Chords connect eQTL to the genes whose transcript levels those eQTL regulate. Chords are colored by the chromosome location of the eQTL.

