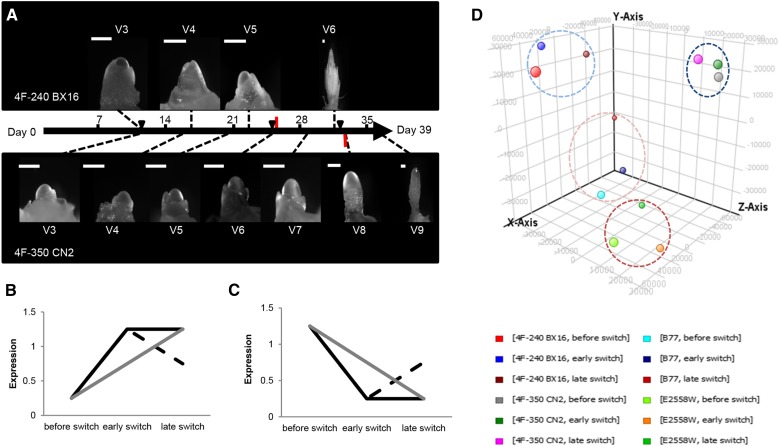
Figure 1.
Transcriptome profiling of leaf tissue during the SAM transition from vegetative to reproductive growth in maize. A, Transition of the SAM of the inbred lines 4F-240 BX 16 (top) and 4F-350 CN 2 (bottom) on a time scale of 39 DAS. The transition of the SAM is marked by red bars, and black triangles indicate times of tissue sampling of the upper most fully expanded leaf. Bars = 200 µm. B and C, Expected expression profiles for putative FTi activators (B) and putative FTi repressors (C). Black lines represent expected expression profiles in genotypes with early SAM transition, and gray lines represent those for genotypes with late transition. D, Principal component analysis of transcriptome data from four selected inbred lines (see Table I). Principal component analysis depicts the mean of transcriptome triplicates per time point and line. The x axis shows component 1 (27.72%), the y axis shows component 2 (18.85%), and the z axis shows component 3 (17.2%). Data sets for 4F-350 CN 2 are circled in dark blue, those for 4F-240 BX 16 are circled in light blue, those for E2558W are circled in dark red, and those for B77 are circled in light red.

