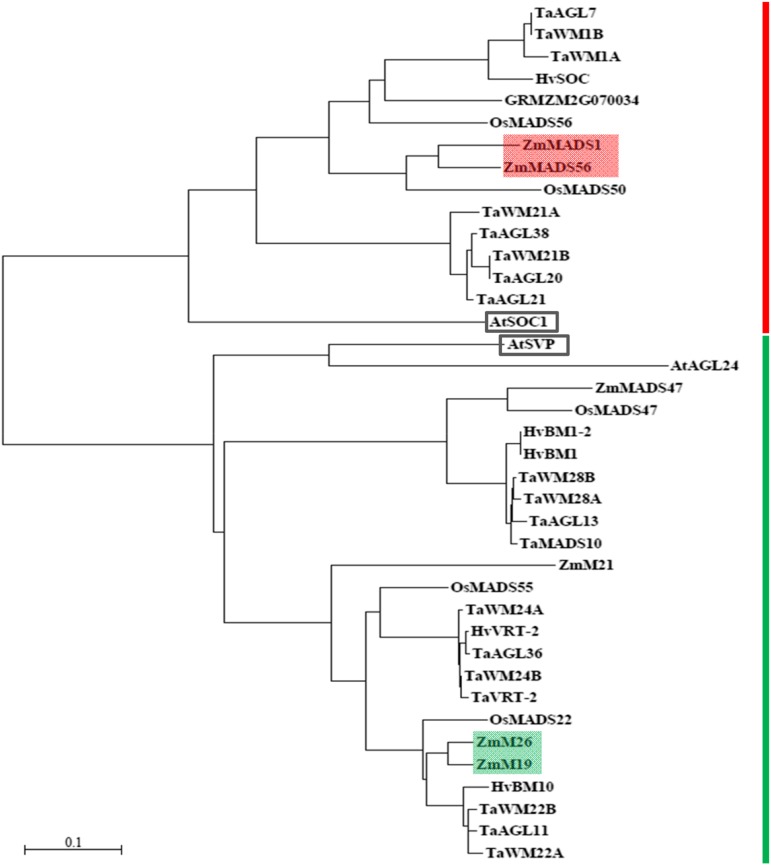
Figure 3.
Phylogenetic tree of ZmMADS1, ZMM26, and homologous proteins in different plant species (for details, see Supplemental Table S2). The subgroups containing ZmMADS1 and ZMM26 are marked by the red and green bars, respectively. ZmMADS1 and its close homolog ZmMADS56 are shaded in red, and ZMM26 and its close homolog ZMM19 are shaded in green. AtSOC1 and AtSVP are framed in black. The bar represents the number of substitutions per amino acid site.

