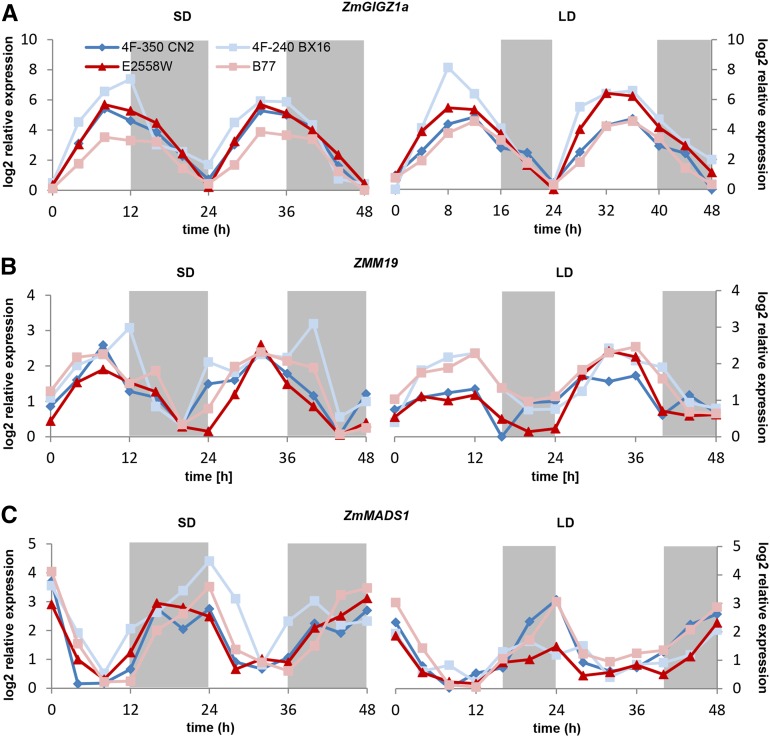
Figure 4.
Diurnal regulation of ZmMADS1 and ZMM19 compared with ZmGIGZ1a in SD and LD conditions. Relative expression levels of ZmGIGZ1a (A), ZMM19 (B), and ZmMADS1 (C) are shown in the selected lines 4F-350 CN 2 (dark blue), 4F-240 BX 16 (light blue), E2558W (dark red), and B77 (light red) over a period of 2 d at 4-h intervals under SD (left) and LD (right) conditions. Means of three biological replicates are shown. The relative expression values are log2 transformed; sd values are not depicted (for details, see Supplemental Tables S3–S8). Gray areas indicate dark periods.

