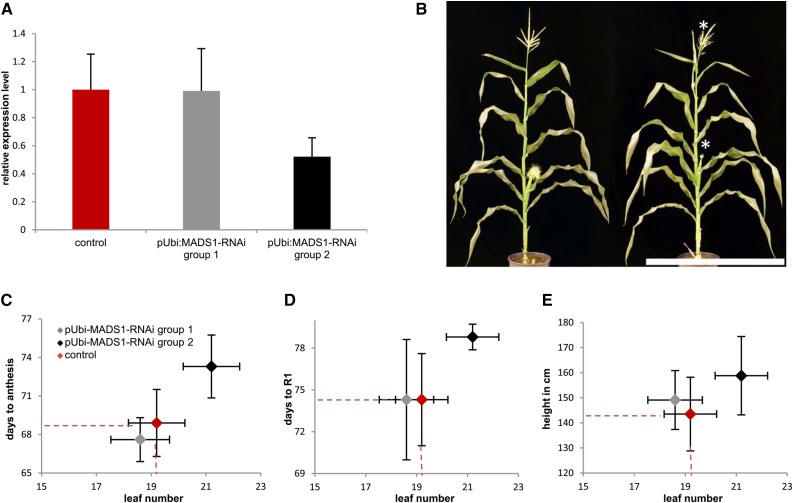
Figure 7.
Characterization of RNAi transgenic maize plants with down-regulated ZmMADS1 (MADS1) expression levels using a ubiquitin promoter (pUBI). A, Relative expression levels of ZmMADS1 in two transgenic groups and a wild-type control group quantified by qRT-PCR (control group, n = 12; group 1, n = 9; and group 2, n = 14). Group 1 showed ZmMADS1 expression levels comparable to wild-type plants. Samples were collected in the morning, when control plants showed maximum expression levels. B, Representative image of segregating wild-type (left) and transgenic progeny (right) plants. Delayed development of tassels and silks (right) compared with the control (left) is indicated by asterisks. Bar = 50 cm. C to E, Correlations between leaf number and time to reach developmental stages of anthesis (C) and R1 (D) and plant height (E) compared between control and the two RNAi plant groups. Means and sd of total leaf number are indicated on the x axis and those of the second trait on the y axis. Mean values of the control group are projected as dashed lines toward the axis. Colors show expression levels of group 1 (gray), group 2 (black), and control (red) plants.

