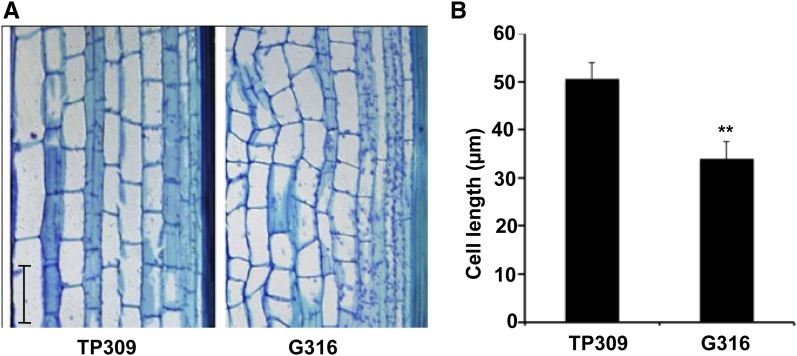
Figure 3.
Cell development was repressed in OsNPR1-OX plants. A, Cell morphology in the longitudinal section of panicle necks of TP309 and G316 at the heading stage. Sections were stained with Toluidine Blue and observed with a light microscope (Leica). Bar = 50 µm. B, Statistical analysis of cell lengths in the parenchyma near the sclerenchyma. More than 100 cells from five individual stem segments were measured for both TP309 and G316. Asterisks indicate significant differences (**, P < 0.01, Student’s t test).

