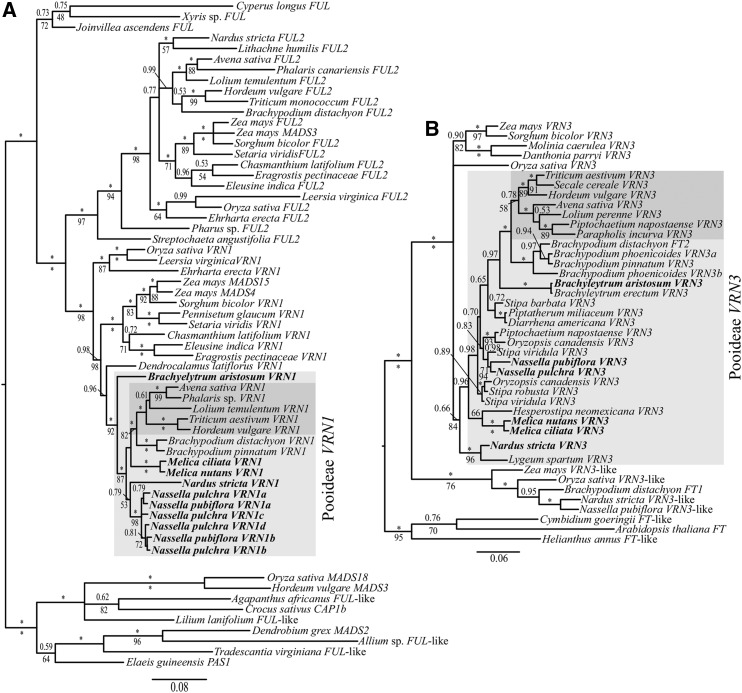
Figure 2.
VRN1 (A) and VRN3 (B) Bayesian 50% majority rule tree with PPs > 0.5 (above branches) and MLB support values > 50% of 1,000 bootstrap replicates (below branches). Bars indicate substitutions per site. Focal genes are indicated in bold, focal clades are denoted with gray boxes, and focal core Pooideae genes are indicated with dark-gray boxes. Asterisks denote PP values of 1.0 and MLB values of 100%.

