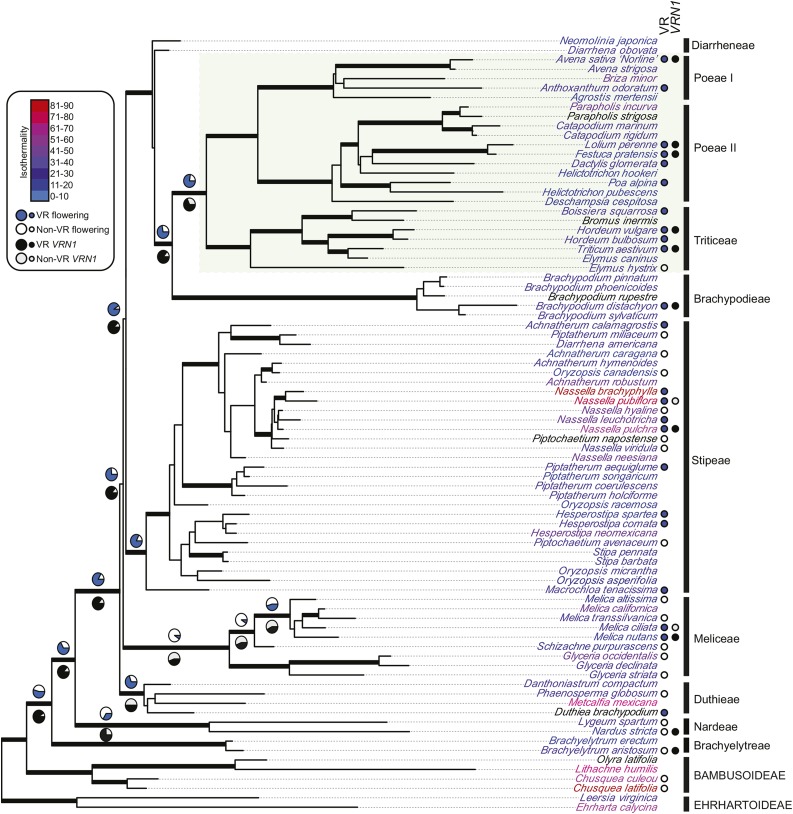
Figure 5.
Best Pooideae Bayesian tree topology based on partitioned matK and ndhF sequences. Thick black branches denote > 0.95 Bayesian posterior probability. Green box defines core Pooideae. Taxon label colors show average isothermality (ratio of diurnal to seasonal temperature variation) based on Worldclim bio3 data extracted from GBIF locality points. Vernalization-responsive (VR) flowering and VRN1 expression are indicated at branch tips where available. Probabilities of responsiveness are shown as pie charts at selected branches of interest.

