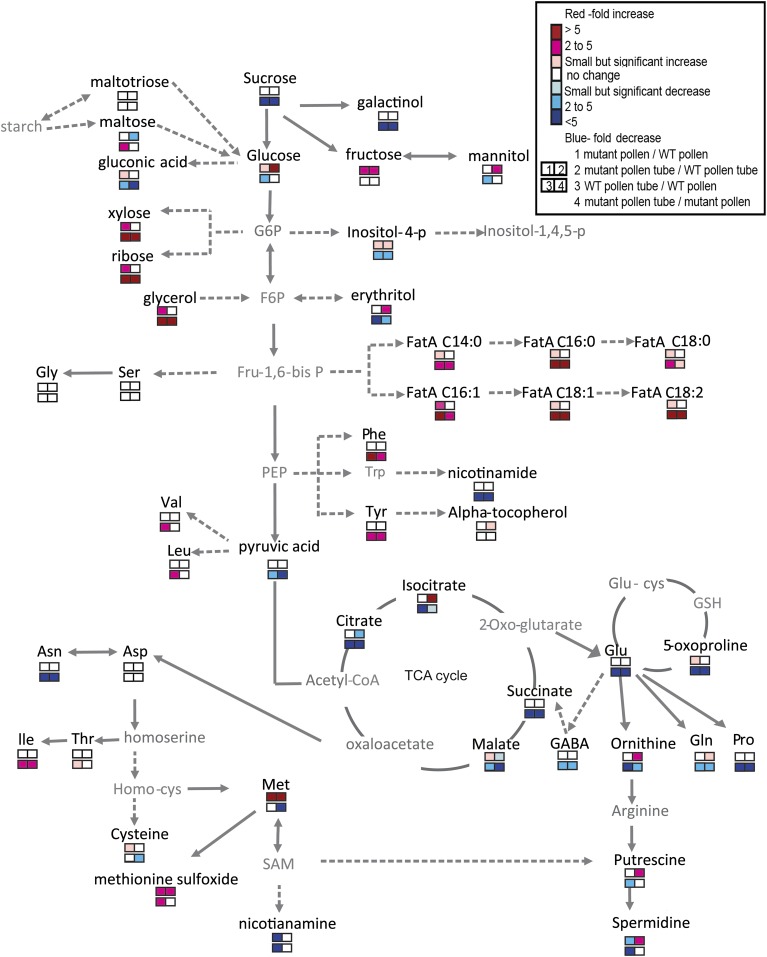
Figure 5.
Metabolite profiles of mat3 and wild-type (WT) mutant pollen and pollen tubes. Changes are represented as fold change between the level of a metabolite in mat3 and in the wild type and are listed in Supplemental Data S1. Solid arrows represent a single-step reaction between two metabolites, and dashed arrows indicate multiple steps. Metabolites in gray were not detected. FatA C14:0, Myristic acid; FatA C16:0, palmitic acid; FatA C18:0, stearic acid; FatA C16:1, palmitoleic acid; FatA C18:1, oleic acid; FatA C18:2, linoleic acid; F6P, fructose6-phosphate; Fru-1,6-bisP, fructose 2,6-bisphosphate; G6P, glucose 6-phosphate; GABA, γ-aminobutyric acid; Glu-cys, glutamyl-l-cysteine; Homo-cys, homocysteine; PEP, phosphoenolpyruvate; SAM, S-adenosyl-methionine.

