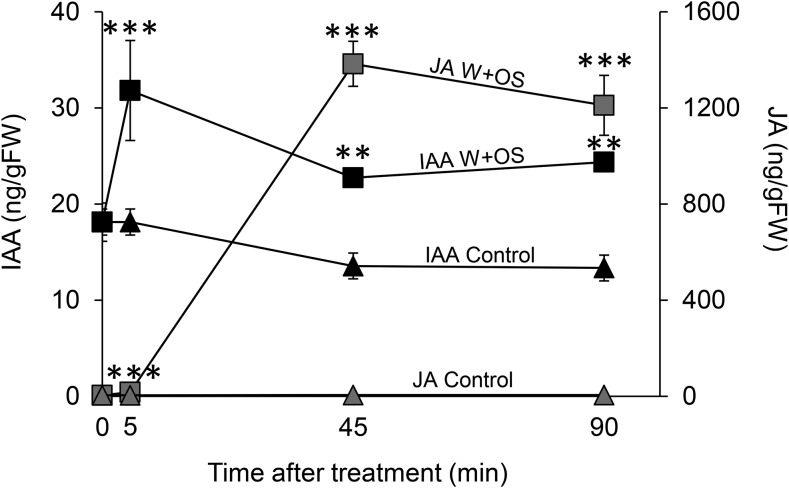
Figure 5.
M. sexta-induced IAA peaks earlier than JA. Left y axis, average (±se) leaf IAA levels in response to M. sexta attack; right y axis, average (±se) leaf JA levels in response to M. sexta attack. Closed squares, IAA levels upon W+OS treatments; closed triangles, IAA levels in control, untreated plants; gray squares, JA levels upon W+OS treatments; gray triangles, JA levels in control, untreated plants (n = 5). Asterisks indicate significant differences between treatments for individual metabolites (P < 0.05). IAA: time, P = 0.015; treatment, P < 0.001; time* treatment, P = 0.638. JA: time, P < 0.001; treatment, P < 0.001; time* treatment: P < 0.001. Control: intact plants; W+OS, wounded and M. sexta oral secretion-treated plants.

