Figure 2.
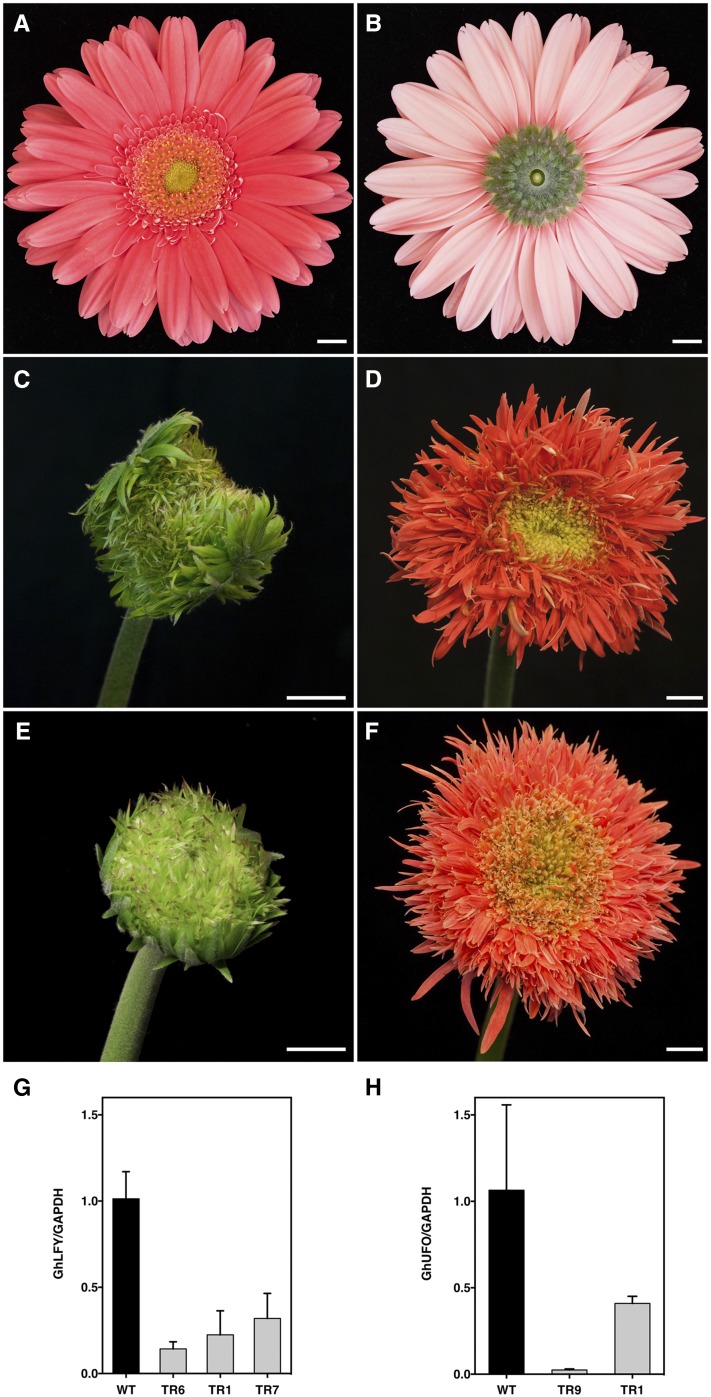
Phenotypes and expression analysis of wild-type gerbera and transgenic lines with suppressed FMI gene expression. A, Mature inflorescence of nontransgenic gerbera. B, Nontransgenic gerbera from the abaxial side. The inflorescence is surrounded by green involucral bracts. C, Phenotype of a strong transgenic GhLFY RNAi line. D, Phenotype of a mild transgenic GhLFY RNAi line. E, Phenotype of a strong transgenic GhUFO RNAi line. F, Phenotype of a mild transgenic GhUFO RNAi line. G, Expression analysis of three independent transgenic lines with suppressed GhLFY expression compared with wild-type (WT) gerbera. H, Expression analysis of two independent transgenic lines with suppressed GhUFO expression compared with wild-type gerbera. Bars = 1 cm (A–F).

