Figure 1.
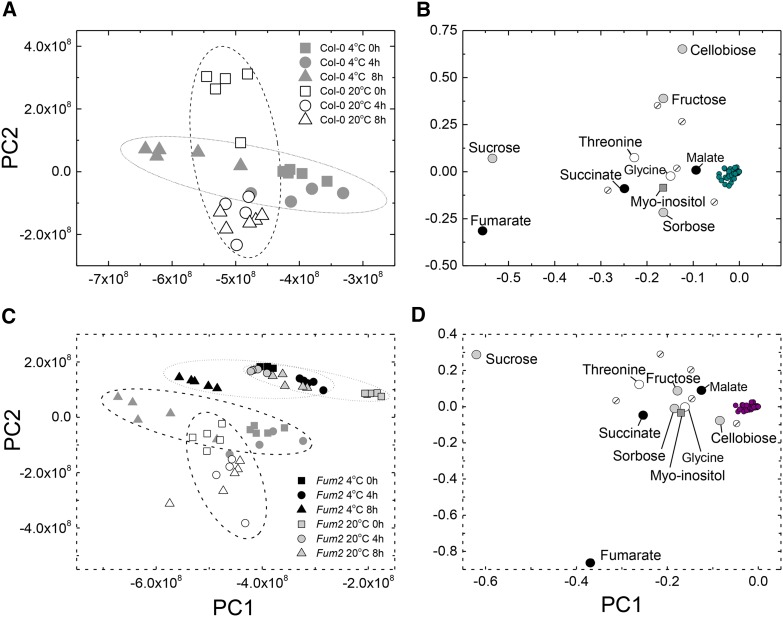
PCA of GC-EI-TOF/MS data from low-temperature-treated plants. Plants of Col-0 and fum2.2 were grown under 100 µmol m2 s−1 light, 8 h light/16 h dark, 500 µL L−1 CO2, and 20°C light/18°C dark conditions for 8 weeks, before being transferred to 4°C for a single photoperiod. Fully expanded leaves were flash frozen and excised at 0 h, 4 h, and 8 h after the photoperiod began. Circles are indicative only and have no statistical significance. A, PCA constructed from the GC-EI-TOF/MS data from the Col-0 wild-type line during the first photoperiod after transfer to 4°C. Ten principal components were used in the calculation, accounting for 98.9% of the total explained variance (TEV). PC1 explained 65.9% TEV, with PC2 explaining a further 27.1% TEV. B, Loading plot of PCA data, indicating metabolites responsible for the variance in the data. C, PCA constructed from the GC-EI-TOF/MS data from both Col-0 wild-type and fum2.2 lines during the first photoperiod after transfer to 4°C. Ten principal components were used in the calculation, accounting for 96.4% TEV. PC1 explained 58.1% TEV, with PC2 explaining a further 31.4% TEV. D, Loading plot of PCA data, indicating metabolites responsible for the variance in the data. In B and D, named metabolites are those judged not to cluster with the majority of metabolites: organic acids are represented by black circles, sugars by gray circles, amino acids by white circles, sugar alcohols by gray squares, and unknown metabolites by striped circles.

