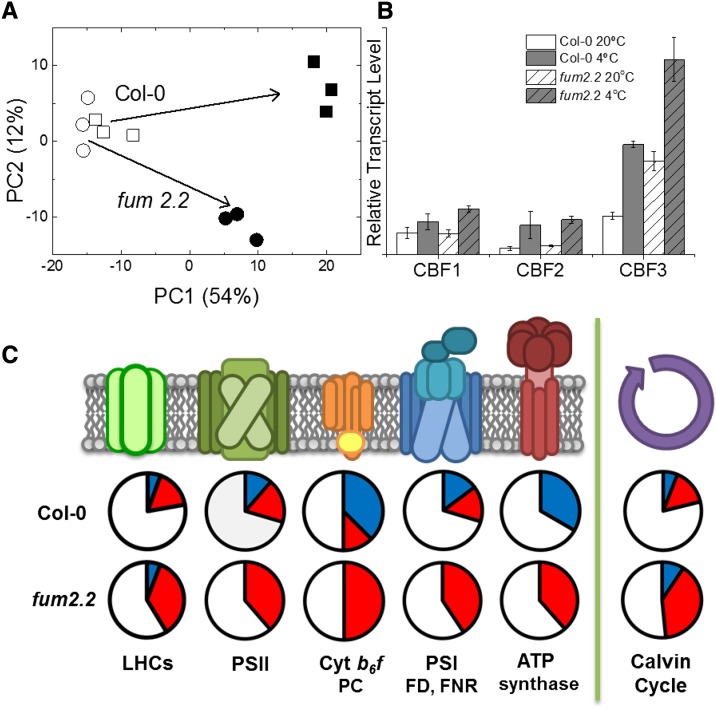
Figure 5.
Microarray analysis of transcript changes in response to cold. Microarray analysis was carried out on total RNA extracted from Col-0 and fum2.2 lines at the end of the first photoperiod after transfer to low temperature. A, PCA model of differences in transcripts between Col-0 (squares) and fum2.2 (circles) under control (white symbols) and cold-treated (black symbols) conditions. B, Relative transcript levels of CBF transcription factors during cold treatment. C, Diagram showing relative changes in transcript level of genes associated with various photosynthetic processes (P < 0.001, fold change > 1.5). Blue sections represent up-regulated genes, red sections represent down-regulated genes, and white sections represent unchanged genes. Abbreviations not defined in the text: FD, ferredoxin; FNR, ferredoxin NADP reductase; LHC, light-harvesting complex; PC, plastocyanin.

