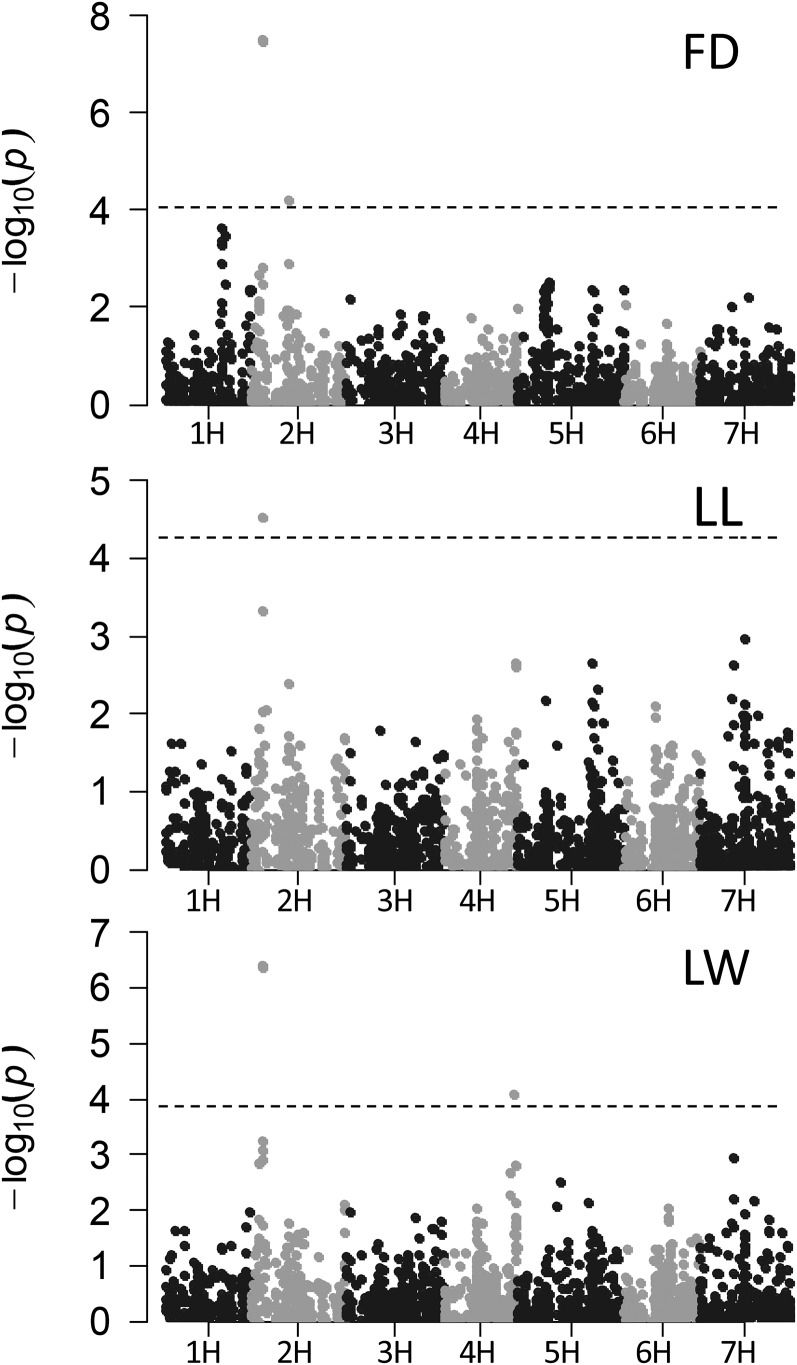
Figure 2.
Manhattan plots of GWAS for FD, LL, and LW in the barley cultivar collection. The −log10 (P values) from the association scans are plotted against the SNP marker positions on each of the seven barley chromosomes. The dashed horizontal lines indicate the genome-wide significance threshold at a false discovery rate < 0.05.

