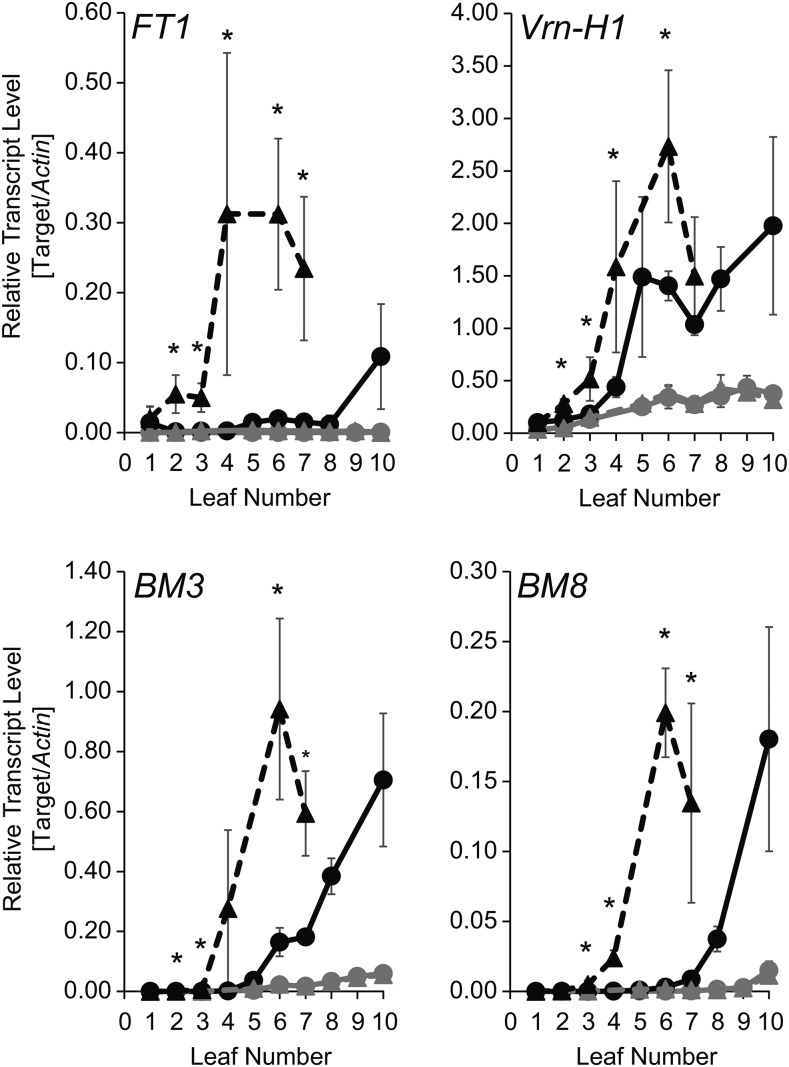
Figure 6.
Expression patterns of FT1 and AP1/FUL-like MADS box transcription factors in successive barley leaves. Quantification of gene expression levels by quantitative real-time (qRT)-PCR is shown for leaf samples harvested from successive leaves emerging from the main shoot of Scarlett (circle) and S42-IL107 (triangle) plants grown under SD (gray) and LD (black) conditions. Expression levels are demonstrated relative to the transcript abundance of the ACTIN housekeeping gene. Error bars represent sd over three biological and two technical replicates. Asterisks indicate significant differences (P < 0.05) in transcript abundance between S42-IL107 and Scarlett when plants were grown under LD conditions.

