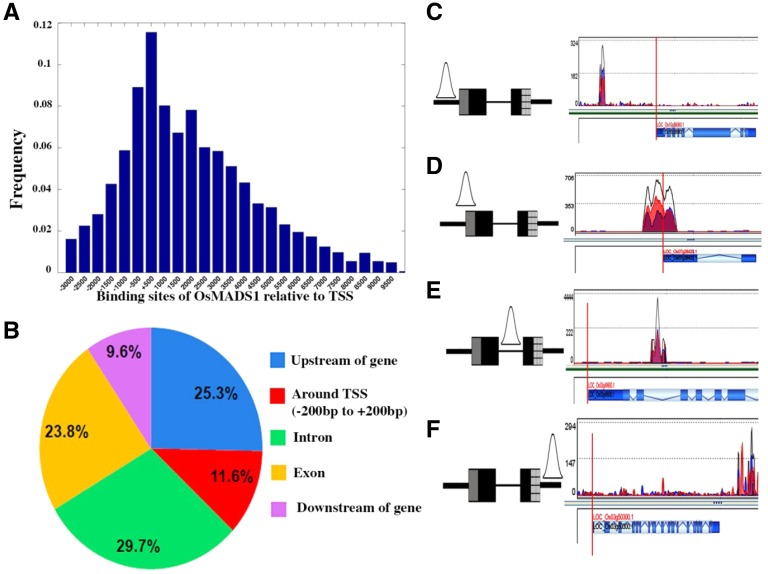
Figure 2.
Genome-wide binding sites of OsMADS1 and the distribution of binding sites in different regions of annotated genes. A, Histogram showing the normalized frequency of occurrence of binding sites of OsMADS1 mapped to the promoters (TSSs) of annotated genes. The binding sites are widely distributed from −3,000 to +10,000, with a peak near the TSSs. B, Pie chart illustrating the location of OsMADS1 binding sites. A majority of the sites lie within the gene body (exons and introns). Approximately 12% of events overlap the TSS (−250 bp to +250 bp) while the remaining events are positioned either further upstream or are downstream of the gene body. Examples of OsMADS1 binding in the up-stream sequences (C), around the TSS (D), to an intronic region (E), and at downstream sequences (F). The vertical red line on schematics marks the TSS. C to F, The schematics to the left illustrate the binding events. Gray box represents the 5′ UTR, black boxes are exons, and the striped box the 3′ UTR. The thin black line between the exons represents the intron and thick black lines mark upstream and downstream sequences. The vertical red line on schematics marks the TSS.

