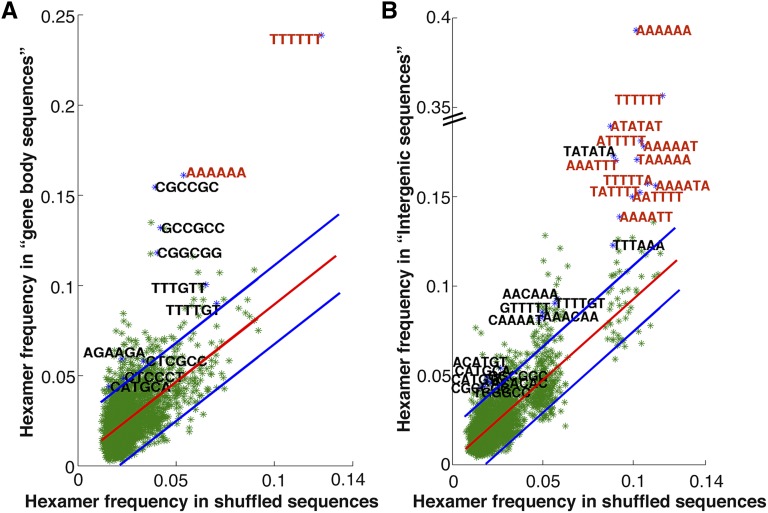
Figure 5.
Frequency of occurrence of all hexamers in approximately 200 bp of OsMADS1-bound DNA. The position of CArG or A-tract motif is taken as zero (and −100 to +100 regions were extracted) for hexamer analyses. A, Hexamer frequency in the gene body data set of 1908 sequences is compared with the frequency in the corresponding shuffled sequences. B, The hexamer frequencies for the 1204 sequences in intergenic data set are compared with the frequencies in shuffled sequences. Here, 130 and 99 hexamers were found to be 2σ deviated in the two data sets, respectively. Hexamers that form a part of the consensus sequences of known transcription factors are labeled in black. Other hexamers with frequencies ≥0.14 are in red.

