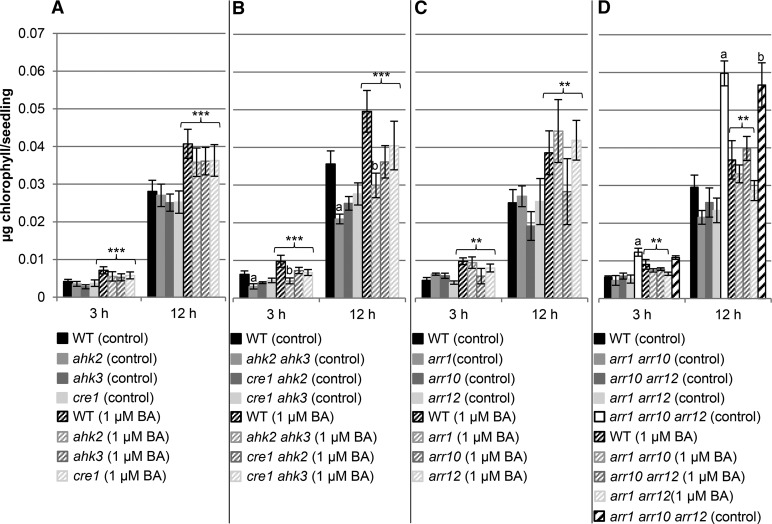
Figure 2.
Greening rate in mutants of the cytokinin signaling pathway. A, Single (ahk2, ahk3, and cre1) and B, double (ahk2 ahk3, cre1 ahk2, and cre1 ahk3) cytokinin receptor mutants, and C, single (arr1, arr10, and arr12) and D, double and triple arr (arr1 arr10, arr1 arr12, arr10 arr12, and arr1 arr10 arr12) mutants were grown for 3 d in dark on medium (MS, no Suc) with or without 1 µM BA. Control conditions are visualized by solid bars; treatment with BA with hatched bars. After exposure to light, chlorophyll content was measured at different time points. Diagrams shown are the average of at least four independent experiments each with three replicates per time point. One replicate consisted of 30 etiolated seedlings grown on one plate. Error bars represent se (n ≥ 3). Letters indicate significant differences between wild type (WT) and the different genotypes under control condition (a) and after BA treatment (b) (P < 0.05). Asterisks above brackets indicate a significant cytokinin effect in the respective genotype (** 0.01 > P > 0.001; *** P < 0.001). Additional time points can be found in Supplemental Figure S1.

