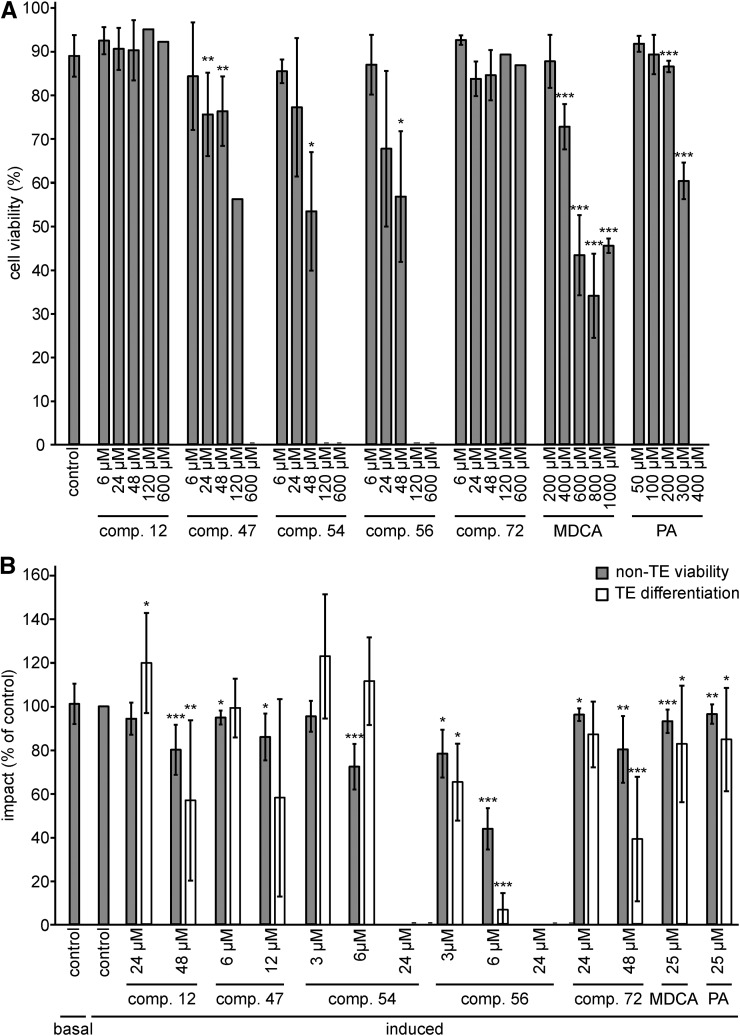
Figure 7.
Impact of the five representative compounds on cell viability and TE differentiation. A, Impact of compounds 12, 47, 54, 56, and 72 on the cell viability of an Arabidopsis (Col-0) pluripotent cell suspension culture after 24 h of treatment. Error bars indicate sd from 18 independent biological replicates for the control and three to four independent replicates for each compound (200–400 cells counted per replicate sample), except for the concentrations at 120 and 600 μm, which represented only one replicate. B, Proportion of viable parenchyma cells not differentiated into TEs (non-TE viability) and changes in TE differentiation efficiency (TE differentiation) after long-term (9-d) treatment with nontoxic concentrations of each representative compound. Results are expressed as percentages of the 2% DMSO-treated controls. Error bars indicate sd of three to 24 independent biological replicates (200–400 cells counted per replicate sample). Statistical differences were estimated using Student’s t test compared with the respective controls. Differences are significant with P values below 0.05 (*), 0.01 (**), and 0.001 (***).

