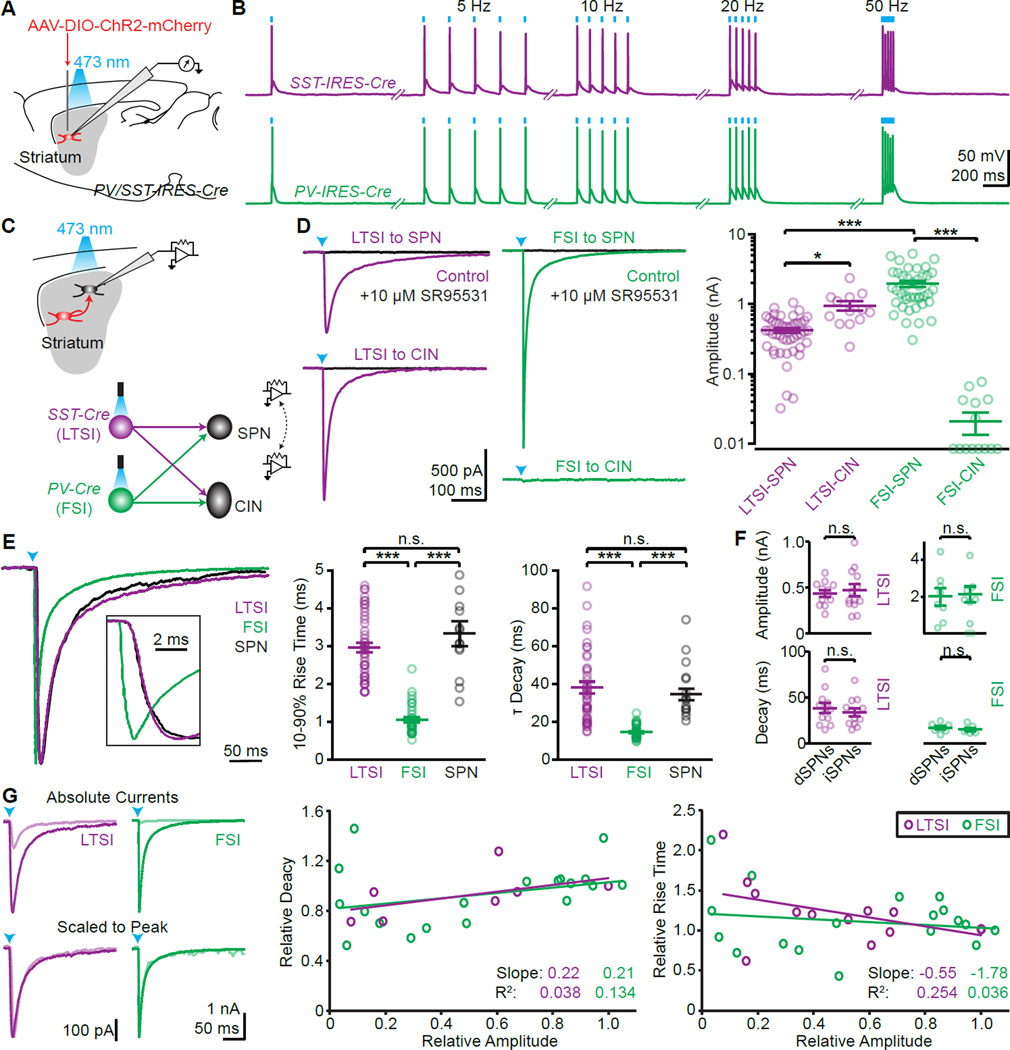
Figure 1. (see also Figure S1): Optogenetic control of LTSIs and FSIs reveals interneuron connectivity.
(A, B) ChR2 was virally expressed in SST (labeling LTSIs) or PV positive (labeling FSIs) cells in the striatum (A), and allowed faithful optical control of spiking activity (B).
(C) The outputs of LTSIs and FSIs were examined by recording from ChR2-negative SPNs and CINs.
(D) Representative examples of synaptic currents (left, arrowheads: light stimulus) and summary of IPSC amplitudes (right).
(E) Representative examples of synaptic currents in SPNs from LTSIs (magenta), FSIs (green), or SPNs (black) scaled to peak (left). Inset shows rising phase. Quantification of 10–90% rise time (middle) and decay time constants (right) across all cells.
(F) No differences in IPSC amplitude (top) or decay kinetics (bottom) were found in direct (dSPNs) and indirect (iSPNs) pathway SPNs.
(G) Example traces of IPSCs in SPNs from LTSIs (magenta) or FSIs (green) (left). Reducing light for ChR2 activation reduced the amplitude (top, light colored traces) but did not affect the kinetics (bottom). The decay (middle) and rising (right) kinetics for LTSI (n=5 cells) and FSI (n=4) inputs were relatively independent of and poorly explained by relative current amplitude.
Bar diagrams represent mean ± SEM; n.s. not significant, * p<0.05, *** p<0.001.

