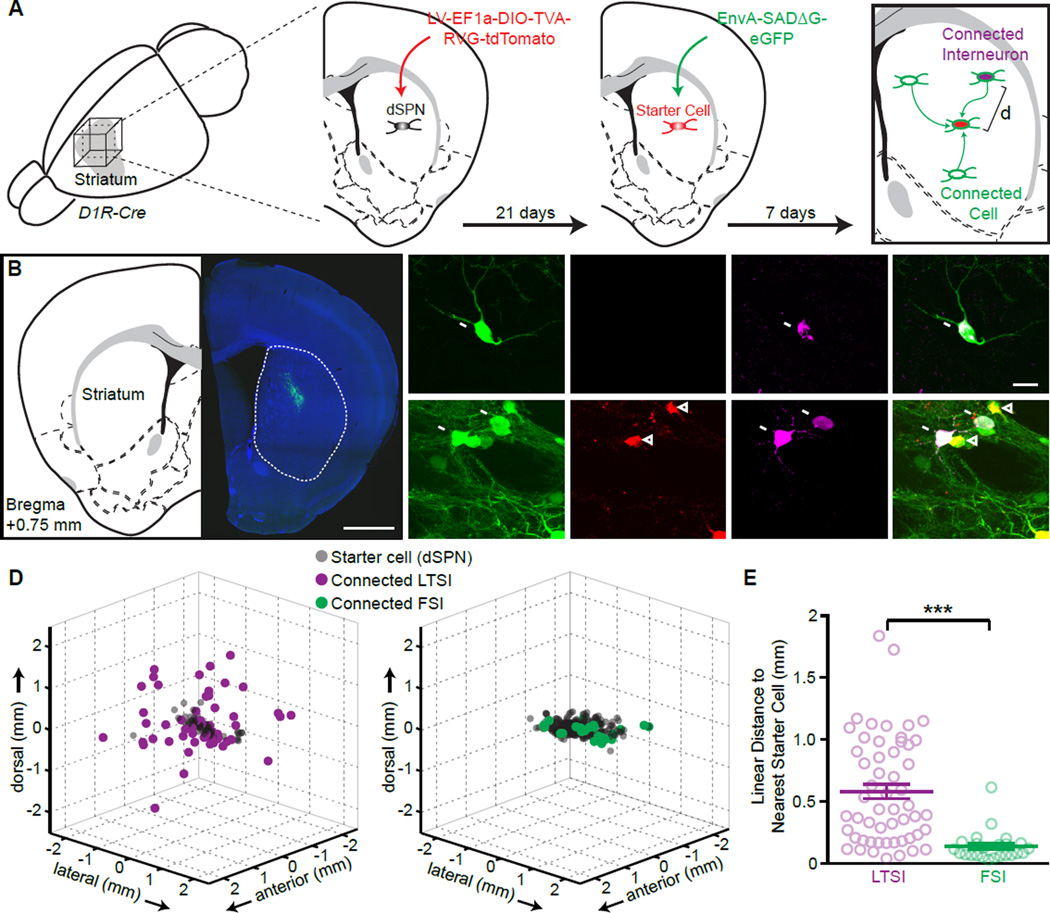
Figure 3. (see also Figure S2): LTSIs target distant postsynaptic cells.
(A) Experimental schematic: a small amount of a cre-dependent lentivirus encoding TVA receptor, rabies virus glycoprotein (RVG), and tdTomato was injected into the central dorsal striatum of Drd1a-cre mice, labeling a small population of dSPNs as starter cells (red). Pseudotyped rabies virus encoding for eGFP (green) was injected 3 weeks later into the same site, labeling starter cells (tdTomato and GFP co-expression) and monosynaptically connected cells (GFP only). Immunohistochemistry against SST or PV (magenta) identified monosynaptically connected LTSIs or FSIs, respectively, and the distance (d) between each connected interneuron and the closest starter cell was determined in 3 dimensions.
(B) Coronal section from a Drd1a-cre mouse showing rabies-virus expression (green) around the injection site in dorsal striatum (right), and corresponding atlas section 0.75 mm anterior of Bregma (left).
(C) Representative images of trans-synaptically labeled LTSI (arrows, top) or FSIs (bottom). Labeled FSIs were usually central to the injection site, in close proximity to starter cells (arrowheads), whereas connected LTSIs were frequently found distant form the injection sites as isolated GFP-positive cells.
(D) 3-dimensional representation of all connected cells identified as LTSIs (left) or FSIs (right). Data are from 4 independent experiments for each condition aligned by the center of mass of the starter cells. The spherical representation of individual cells is for display purposes and over-represents size of cells.
(E) The distances from each connected interneuron to the closest starter SPN are greater for LTSIs (magenta) than for FSIs (green). Bar diagram: mean ± SEM, *** p<0.001.

