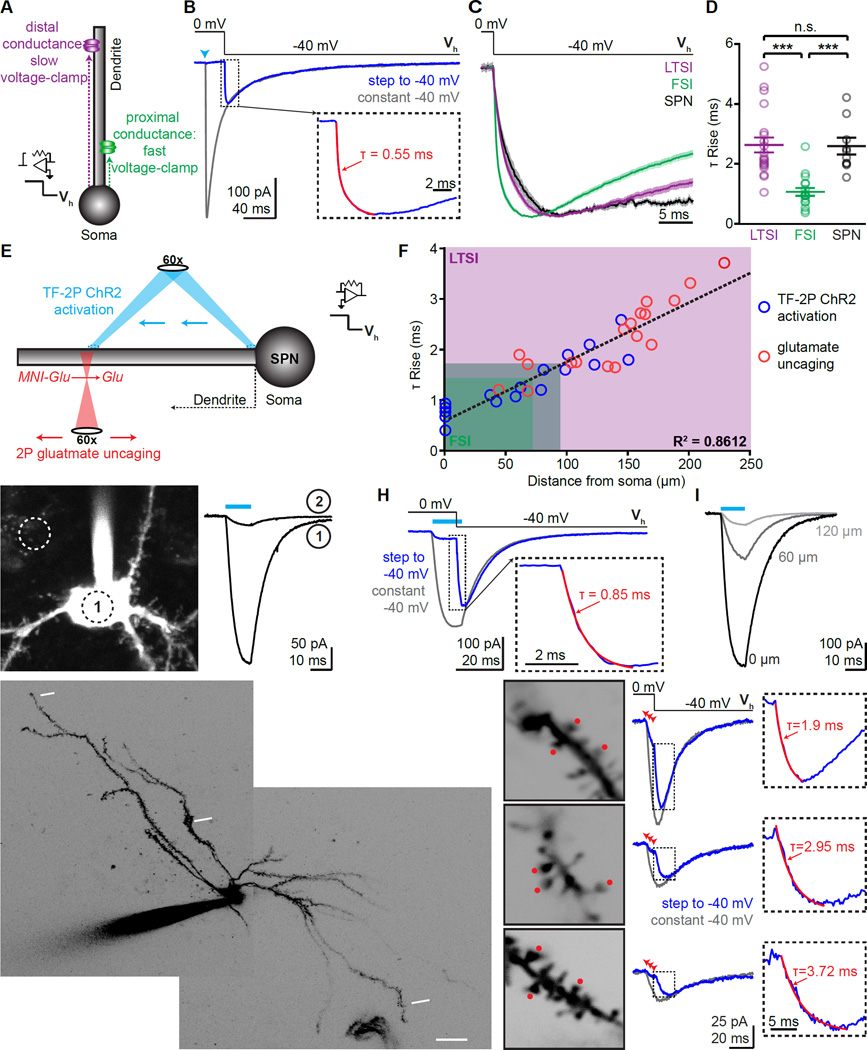
Figure 4. (See also Figures S3, 4): Proximal-distal distribution of FSI and LTSI connections onto SPNs.
(A) Schematic of voltage-jump experiments: stepping the holding potential (Vh) to apply a stronger driving force increases the amplitude of activated currents. Sites further from the somatic recording electrode take longer to reach the new holding potential (magenta). Thus, onset kinetics of synaptic currents in voltage jumps reflects the proximal-distal location of the synapse.
(B) Example of voltage-jump experiment: under control conditions (Vh constantly −40 mV, gray trcae) an IPSC evokes an inward current. When holding the cell initially at 0 mV, activation of the synapse (arrowhead) does not result in current despite GABAA receptors being activated (control trace), until a negative holding potential is applied (Vh from 0 mV to −40 mV, blue). Insert shows rise phase of voltage jump, superimposed with exponential fit (red).
(C) Current-onset in voltage-jump experiments as shown in (B) for all LTSI, FSI, and lateral SPN inputs. Lines indicate average, shaded areas represent S.E.M.
(D) Individual rise times for current onset in voltage-jump are slower for LTSI and SPN synapses, indicating a distal dendritic distribution.
(E) Schematic of calibration experiments: Two approaches were used to correlate the dendritic location of a conductance with its rise time in voltage-jump experiments. In ChR2-expressing SPNs, TF (940 nm) was used for activation at various locations along a dendrite (top, blue; G–I). Alternatively, 2P uncaging was used to activate glutamatergic synapses (bottom, red; J,K). Both types of currents were combined with voltage-jump recordings.
(F) Summary data from TF-2P ChR2 activation (n=17 locations/10 cells) and glutamateuncaging (18/10) experiments. The proximal-distal distance of individual conductances correlated with rise time in voltage-jumps. Shaded area: 10–90% distribution for LTSI (magenta) and FSI inputs (green).
(G) Example of a ChR2-expressing SPN (left). Circles indicate ~size of the TF laser spot and its location on the soma (1) or next to it (2). ChR2 currents evoked by a 10 ms illumination (cyan bar) at the two locations (right) demonstrate spatial specificity of TF.
(H) Example of a voltage-jump experiment with TF 2P ChR2 activation, analogous to (B), but with ChR2 current as conductance. Light was 12 ms, and the voltage step was 10 ms into the stimulus.
(I) Moving TF activation distally quickly reduced current size. Numbers indicate distance from soma.
(J) 2P image of example SPN, indicating 3 different sites probed by glutamate uncaging.
(K) left, High-magnification images of sites indicated in (F). Red dots mark uncaging positions, numbers indicate distance from soma along. middle, Voltage-jump experiments for each site, arrowheads indicate uncaging. right, Rise time of voltage-jumps correlated with distance of the uncaging site (right).
Bar diagrams represent mean ± SEM, *** p<0.0001, n.s. not significant.

