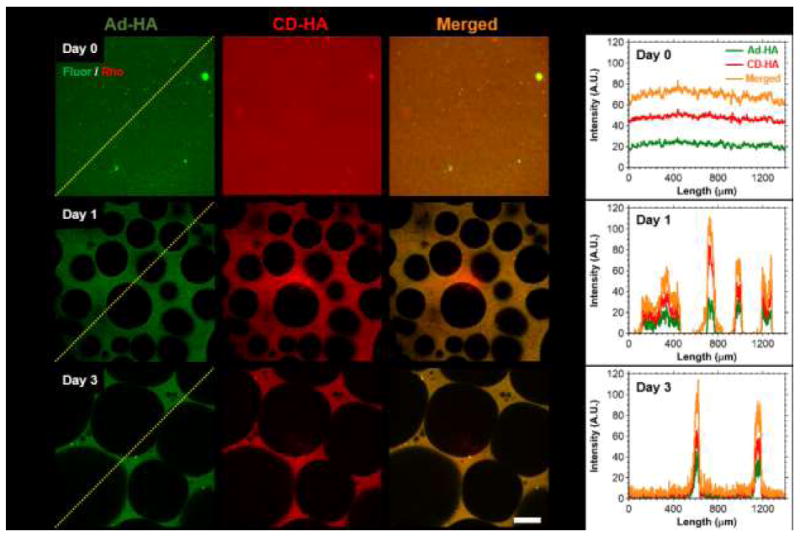
Fig. 3.

Temporal evolution of hydrogel porosity and component co-localization. (A) Representative fluorescent confocal microscopy images of GH hydrogels (2.5 wt%) at day 0 (top), day 1 (middle) and day 3 (bottom), where components were separately labeled for imaging: Ad-MeHA-Fluor (green) and CD-MeHA-Rho (red). Scale bar: 100μm. (B) Corresponding normalized intensity profiles along the paths indicated (yellow dotted line), illustrating spatiotemporal co-localization of guest and host polymers.
