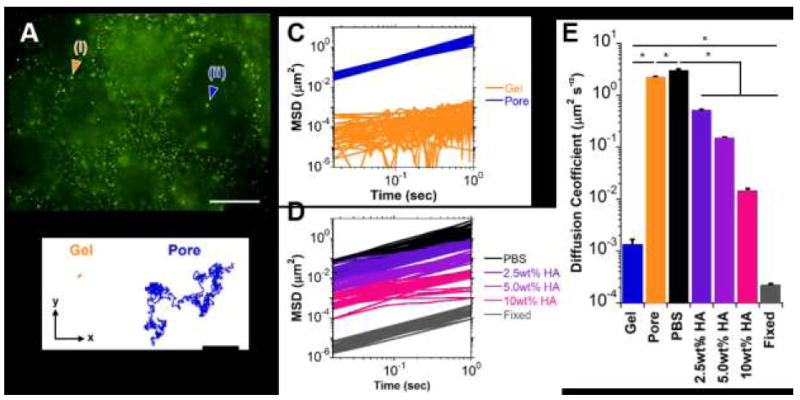
Fig. 7.

Microrheological examination of guest-host hydrogels (Day 7; 2.5 wt%). (A) Representative epifluorescent image of microbeads (0.2 μm diameter) entrapped within the hydrogel (i) or diffusing throughout the pores (ii). Scale bar: 50μm. (B) Trajectories of particle motion within the x-y plane over a 30 second period for a microbead engrafted within the hydrogel (Gel, orange) or diffusing throughout a pore (Pore, blue). (C-D) Mean squared distance (MSD) traces of particle motion as a function of time for representative subpopulations (n=20 particles/group shown) within the hydrogel (C) and for solutions consisting of PBS or soluble hyaluronic acid (2.5, 5.0, 10.0 wt% HA in PBS) and fixed (non-diffusive) controls (D). (E) Diffusion coefficients, determined by fit to eq. (2) (mean ± SE; n > 25; *p < 0.05).
