. 2016 Oct 4;8:ecurrents.outbreaks.115761d5d6de6a8bc7dd4b41f0f5f142. [Version 1] doi: 10.1371/currents.outbreaks.115761d5d6de6a8bc7dd4b41f0f5f142

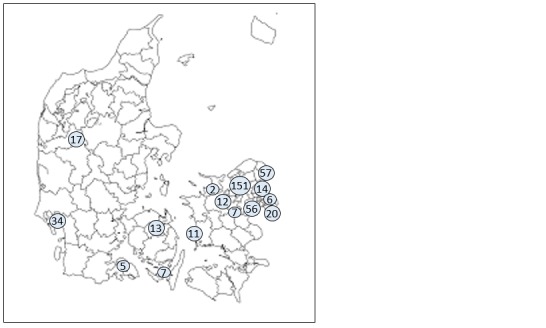
Figure 2. Map of Denmark showing the location of norovirus outbreaks related to green coral lettuce, April 2016. The map shows the outline of Denmark with its 98 Danish municipalities and the occurrence of outbreaks depicted as circles. The numbers indicate the combined number of patients within the area (n=412). Each circle may refer to more than one outbreak.

Figure 2. Map of Denmark showing the location of norovirus outbreaks related to green coral lettuce, April 2016. The map shows the outline of Denmark with its 98 Danish municipalities and the occurrence of outbreaks depicted as circles. The numbers indicate the combined number of patients within the area (n=412). Each circle may refer to more than one outbreak.