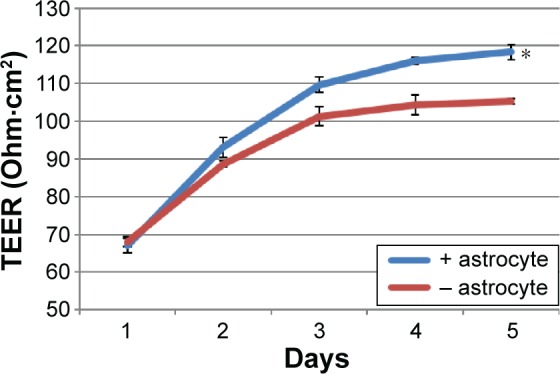
Figure 6.

Comparison of the TEER values between the two different BBB models.
Notes: Data are shown as the mean ± SD; N=3, *P<0.05 compared with the nonastrocyte-cultured BBB model.
Abbreviations: BBB, blood–brain barrier; SD, standard deviation; TEER, transendothelial electrical resistance.
