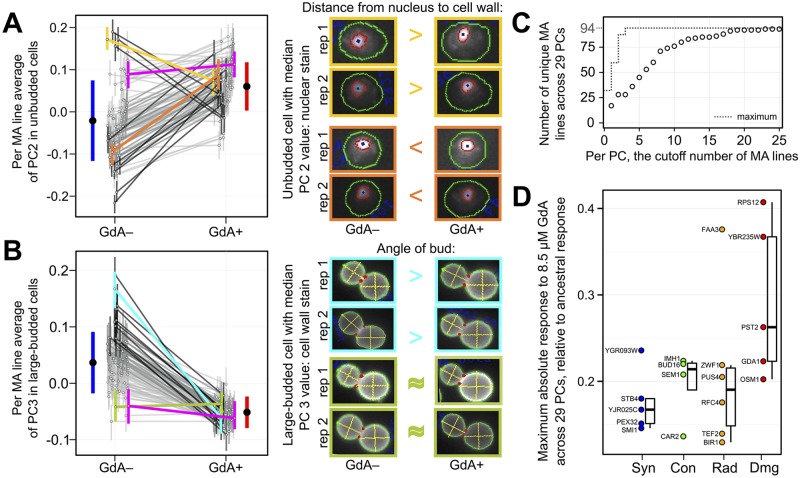
Fig 3. Many MA lines possess spontaneous mutations with GdA-dependent effects on morphology.
(A–B) Two example phenotypes for which some MA lines have unique responses to GdA (for other phenotypes, see S2 Fig). Each open circle and its associated vertical bar represents the average morphology of an individual MA line in either the GdA− or GdA+ condition, +/– 1 standard deviation. Lines connect open circles representing the same MA line; the darkness of each black line is proportional to how much a given MA line’s response to GdA differs from the ancestor’s. Colored lines: magenta = MA ancestor; yellow = MA line #2; orange = MA line #30; cyan = MA line #42; olive = MA line #137. Micrographs (with cell images adjusted for uniform size and orientation) reflect how morphological traits that contribute strongly to each PC respond to GdA in selected strains. The cells shown from each replicate (“rep 1” or “rep 2”) possess the value closest to the median for a given PC in the given strain and treatment. The trait that contributes most strongly to each PC is listed above the cell images (and in S1 Table); the >, <, or ≈ symbols indicate how this trait differs in GdA− versus GdA+ cells. Each solid black circle and its associated blue or red vertical bar reports the average phenotype +/– 1 standard deviation across all MA lines in GdA− or GdA+. (C) The MA lines with the most divergent responses to GdA, relative to the ancestral response, differ for different PCs (see also S3 Fig and S2 Table). This cumulative distribution describes the number of unique MA lines represented among the top 1 through 25 most-divergently responding MA lines for each PC (open circles). The dotted line shows the maximum possible value. (D) MA lines possessing coding mutations predicted to have severe effects on protein function tend to have greater responses to GdA relative to the ancestral response (see also S2 Table). Open circles represent 20 of the 94 MA lines that each possess only a single coding mutation. The mutated gene is listed next to the circle. Vertical axis represents the maximum absolute value of the difference in MA line versus ancestral response to GdA across all 29 PCs. Boxplots represent the distribution of these maximum absolute differences for MA lines with either a single synonymous (“Syn”), conservative (“Con”), radical (“Rad”), or damaging (“Dmg”) mutation, displaying the median (center line), interquartile range (IQR) (upper and lower hinges), and highest value within 1.5 × IQR (whiskers).

