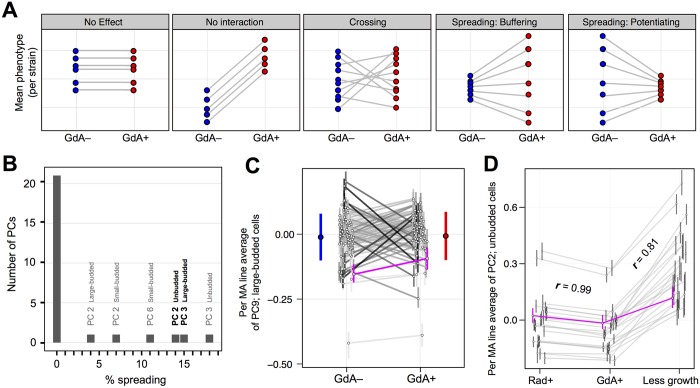
Fig 4. Epistatic interactions between Hsp90 and spontaneous mutations do not often involve buffering or potentiation.
(A) Models of the different effects that Hsp90 might have on phenotypic variation between strains are shown. Each plot displays median phenotype per strain in GdA− (blue circles) and GdA+ (red circles); each line connecting two circles follows the change that Hsp90 inhibition has on a given strain. When lines have different slopes, GdA has a genotype-specific effect (rightmost 3 models). Line-crossing epistasis can be distinguished from buffering or potentiating, which are line-spreading subtypes of epistasis. (B) Line-crossing epistasis is far more prevalent than buffering or potentiation between Hsp90 and the spontaneous mutations present in the MA lines. The horizontal axis represents the fraction of the interaction between GdA and genotype that can be explained by line spreading (as opposed to line crossing); the vertical axis represents the number of PCs that fall into each bin, where bin width is 1%. PCs for which line spreading contributes >1% of this interaction are labeled; bold-labeled PCs are those plotted in Fig 3A and 3B. (C) An example phenotype for which line crossing contributes >99% (spreading contributes <1%) of the interaction between GdA and MA lines. These data are plotted as in Fig 3A. (D) The effects of GdA on MA line morphology are more similar to the effects of another Hsp90 inhibitor radicicol (Rad) than they are to the effects of abbreviated growth. Displayed plots are similar to those in Fig 3A, except here they show a random subset of 22 MA lines that were imaged after growth in GdA, Rad, and in a “less growth” condition in which we reduced the duration of exponential phase from 6 to 4 h (see Experimental Procedures). This PC was chosen because both correlation coefficients (r) are close to their median values across all 29 PCs (for all PCs, see S4 Fig).

